
EPAWA’s long range outlook is updated weekly every Friday morning before noon
Most recent update: Friday November 13th, 10:45 AM
Technical discussion for advanced readers:
The technical discussion below will feature two (2) subcategories: Precipitation, and Pattern Discussions. Storm possibilities will be discussed exclusively in the Premium Forum with intense model analysis leading up to any major snow, ice, or rain events, not publicly. To join this discussion and hear the updated thoughts from our team, visit The My Pocket Meteorologist Page by clicking HERE and select the “Premium Weather Forum” option.
Precipitation Discussion
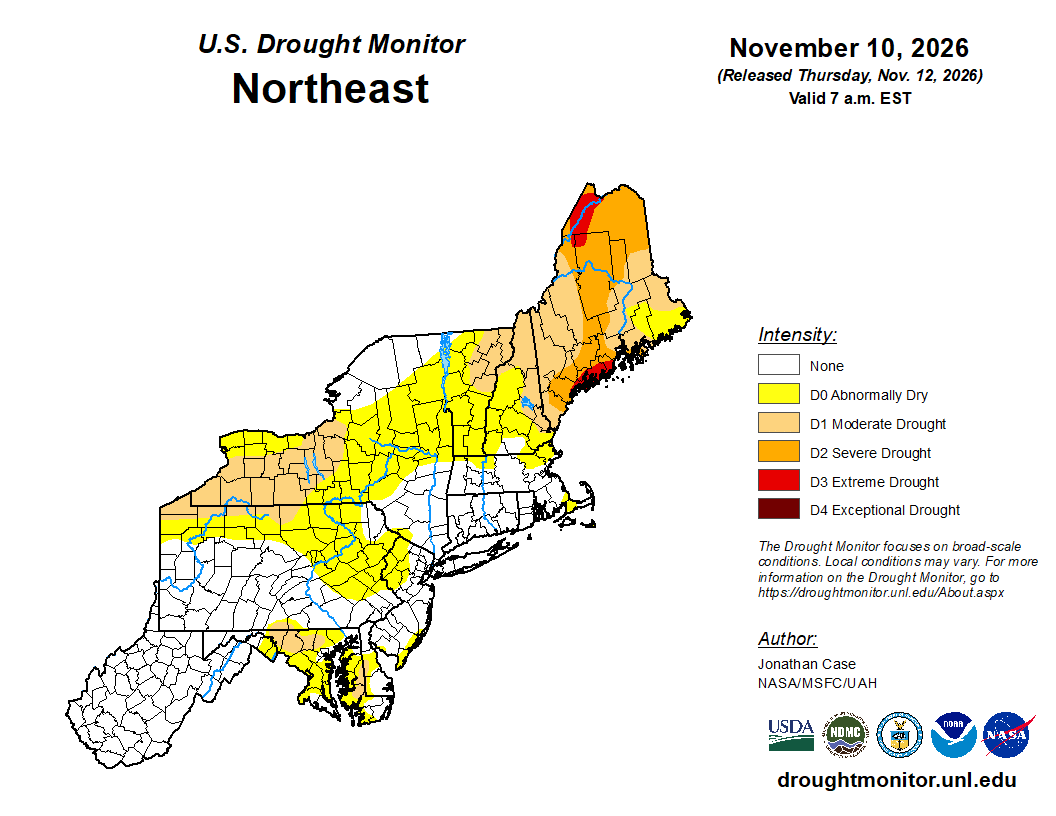
OVERVIEW: Aside from a small area in NW Maryland and SE Franklin County (PA) as well as a part of the MD Eastern shore where a drought still exits, the remainder of the area is currently without a drought designation. This week’s outlook has however expanded the abnormally dry area into North Central PA and parts of NE PA, and maintains it in Western portions of Northern New Jersey back through the Lehigh Valley and Berks County in Pennsylvania.
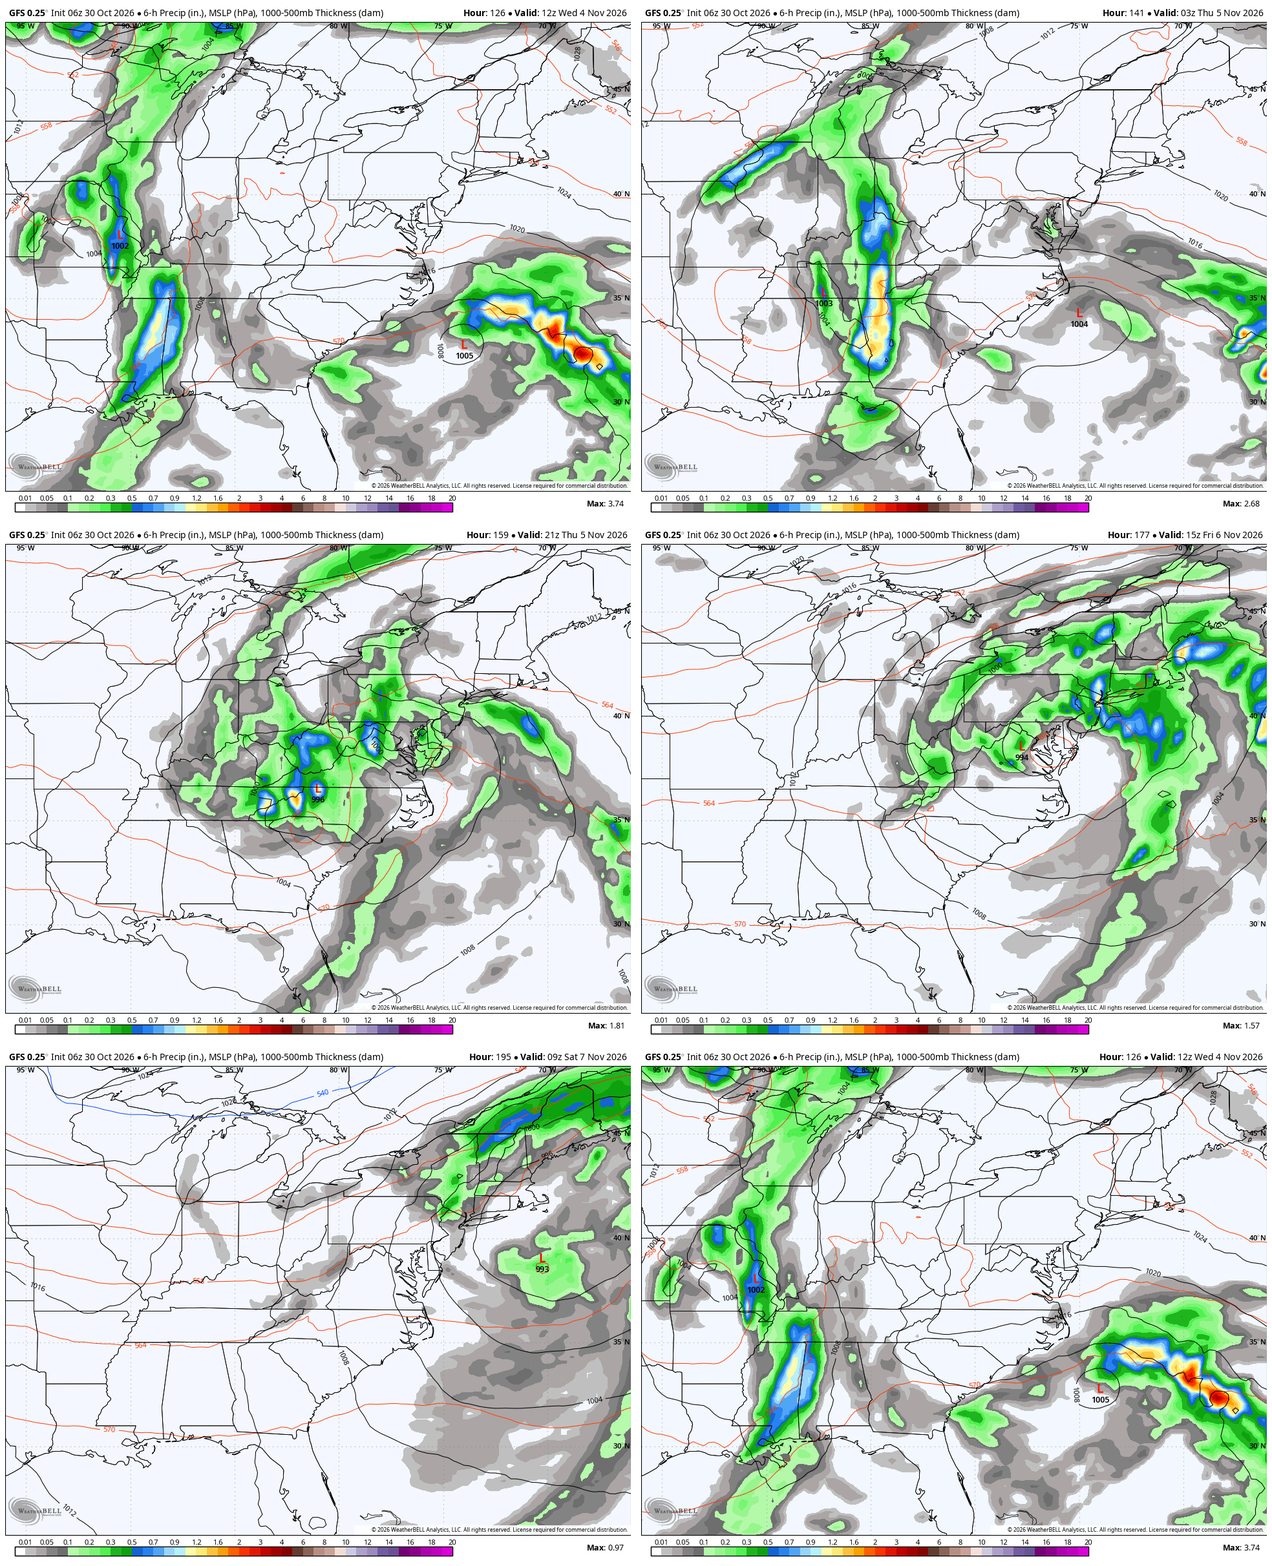
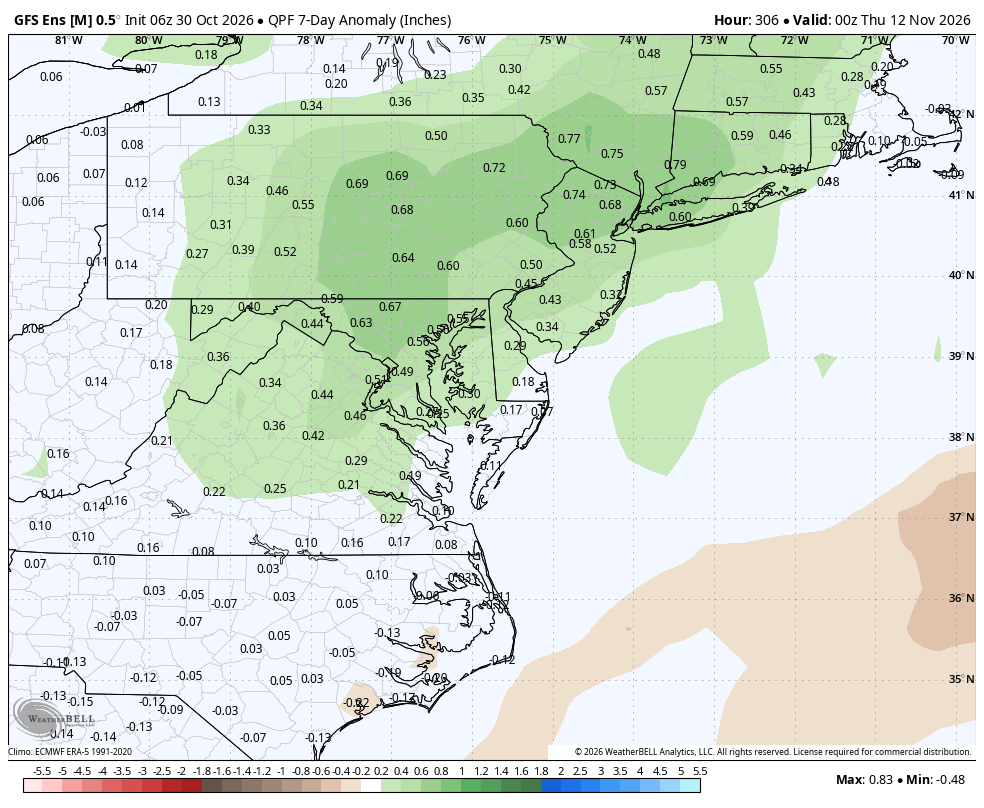
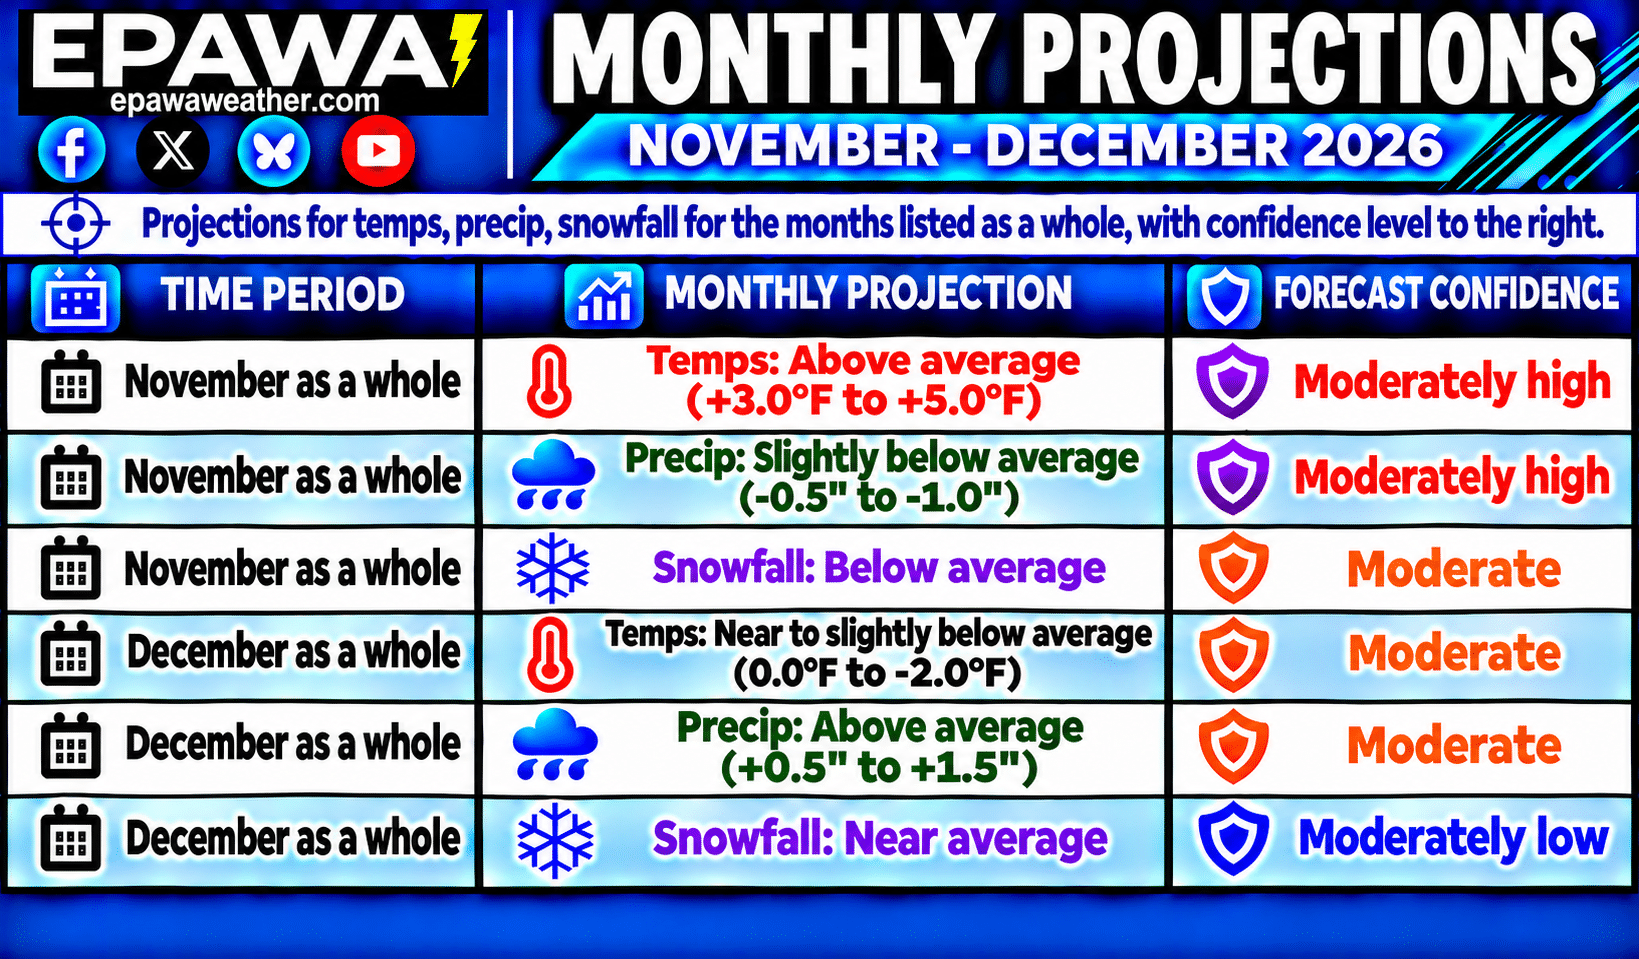
November projections were maintained this week for slightly below average (-0.5″ to -1.0″) precipitation with the can being kicked down the road on the expected El Niño wetter pattern until late in the month, and a relatively dry overall period over the next 10 days… with below average snowfall. December projections were also maintained this week for an above average (+0.5″ to +1.5″) precipitation departure for the month as a whole, in accordance with longer term climate models and global observation trends, along with near average snowfall.
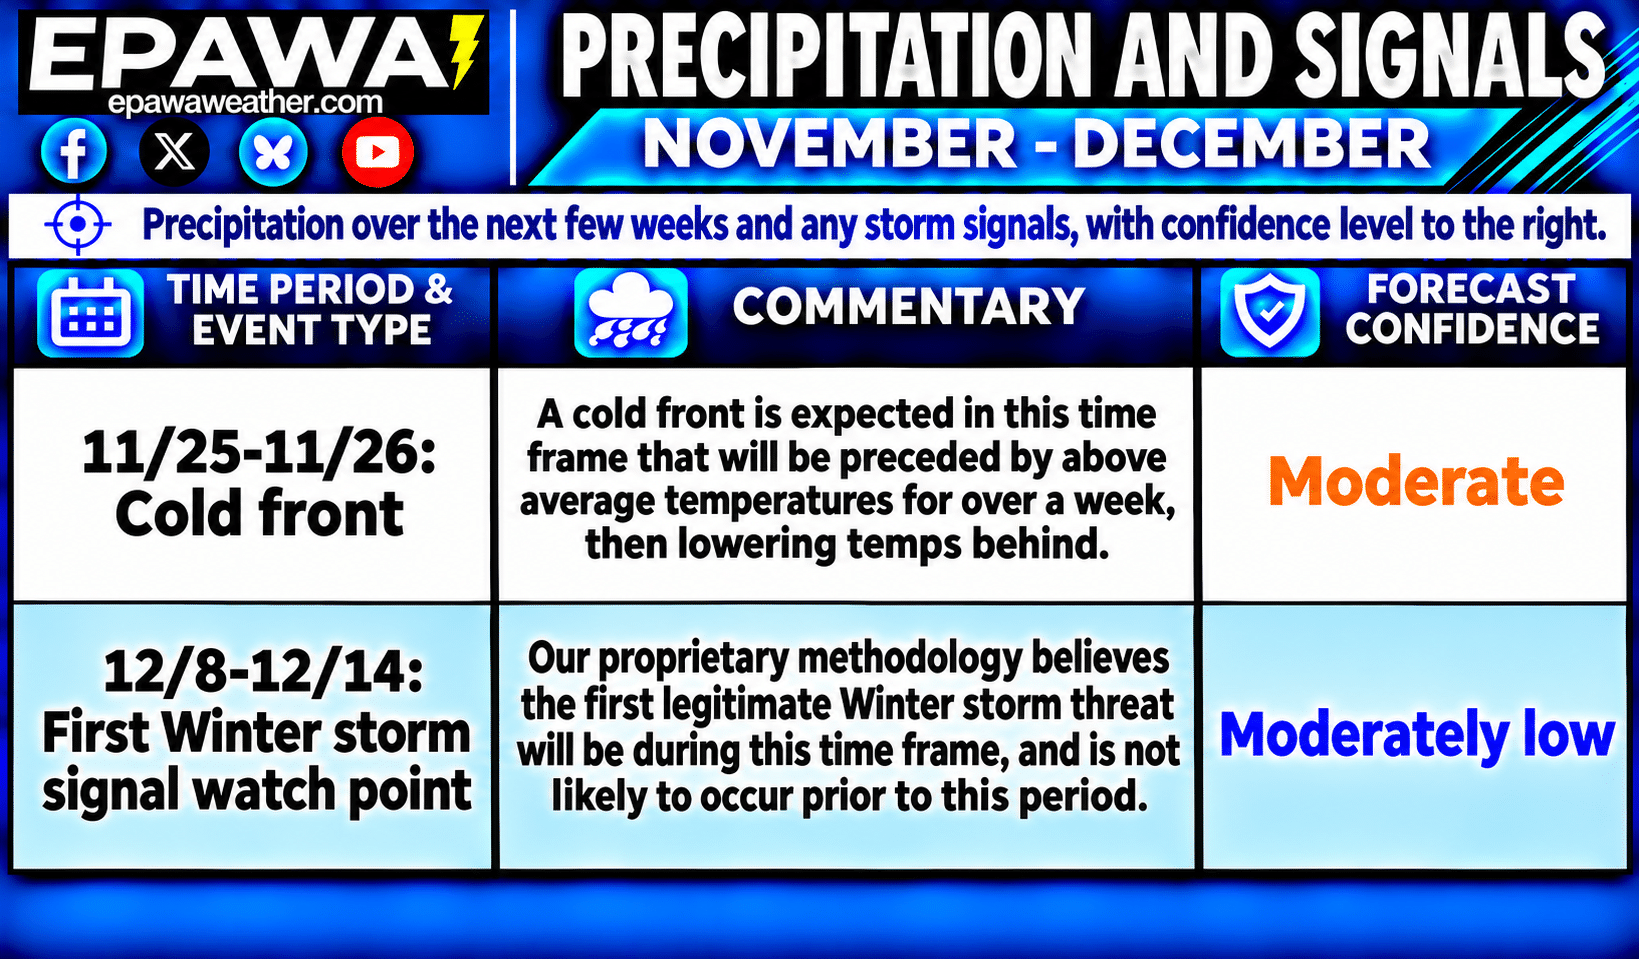
Shorter term, an overall dry period is expected over the next 10+ days after the current system departs. We expect a cold front in the middle of the 4th week of November as the next rain chance, which will come in the form of a cold front. Unusually mild conditions will be found ahead of that boundary, then returning to near average temperatures late month in its wake. We highlighted the 2nd week of December for any early season snow possibilities, but not a true Winter Storm Signal in the traditional sense… just a watch point for now.
Breakdown of precipitation departures from normal over the next several weeks:
November 14th – November 20th: Below average or none
November 21st – November 27th: Near to slightly above average
November 28th – December 4th: Slightly above average
December 5th – December 11th: Slightly above average
December 12th – December 18th: Slightly above average
December 19th – December 25th: Slightly above average
Public/free available maps will be updated when a threat is imminent for significant weather on the weather alerts page throughout the year: http://epawaweather.com/weather-alerts/
Note: Any image below is clickable for larger viewing
Pattern Discussion
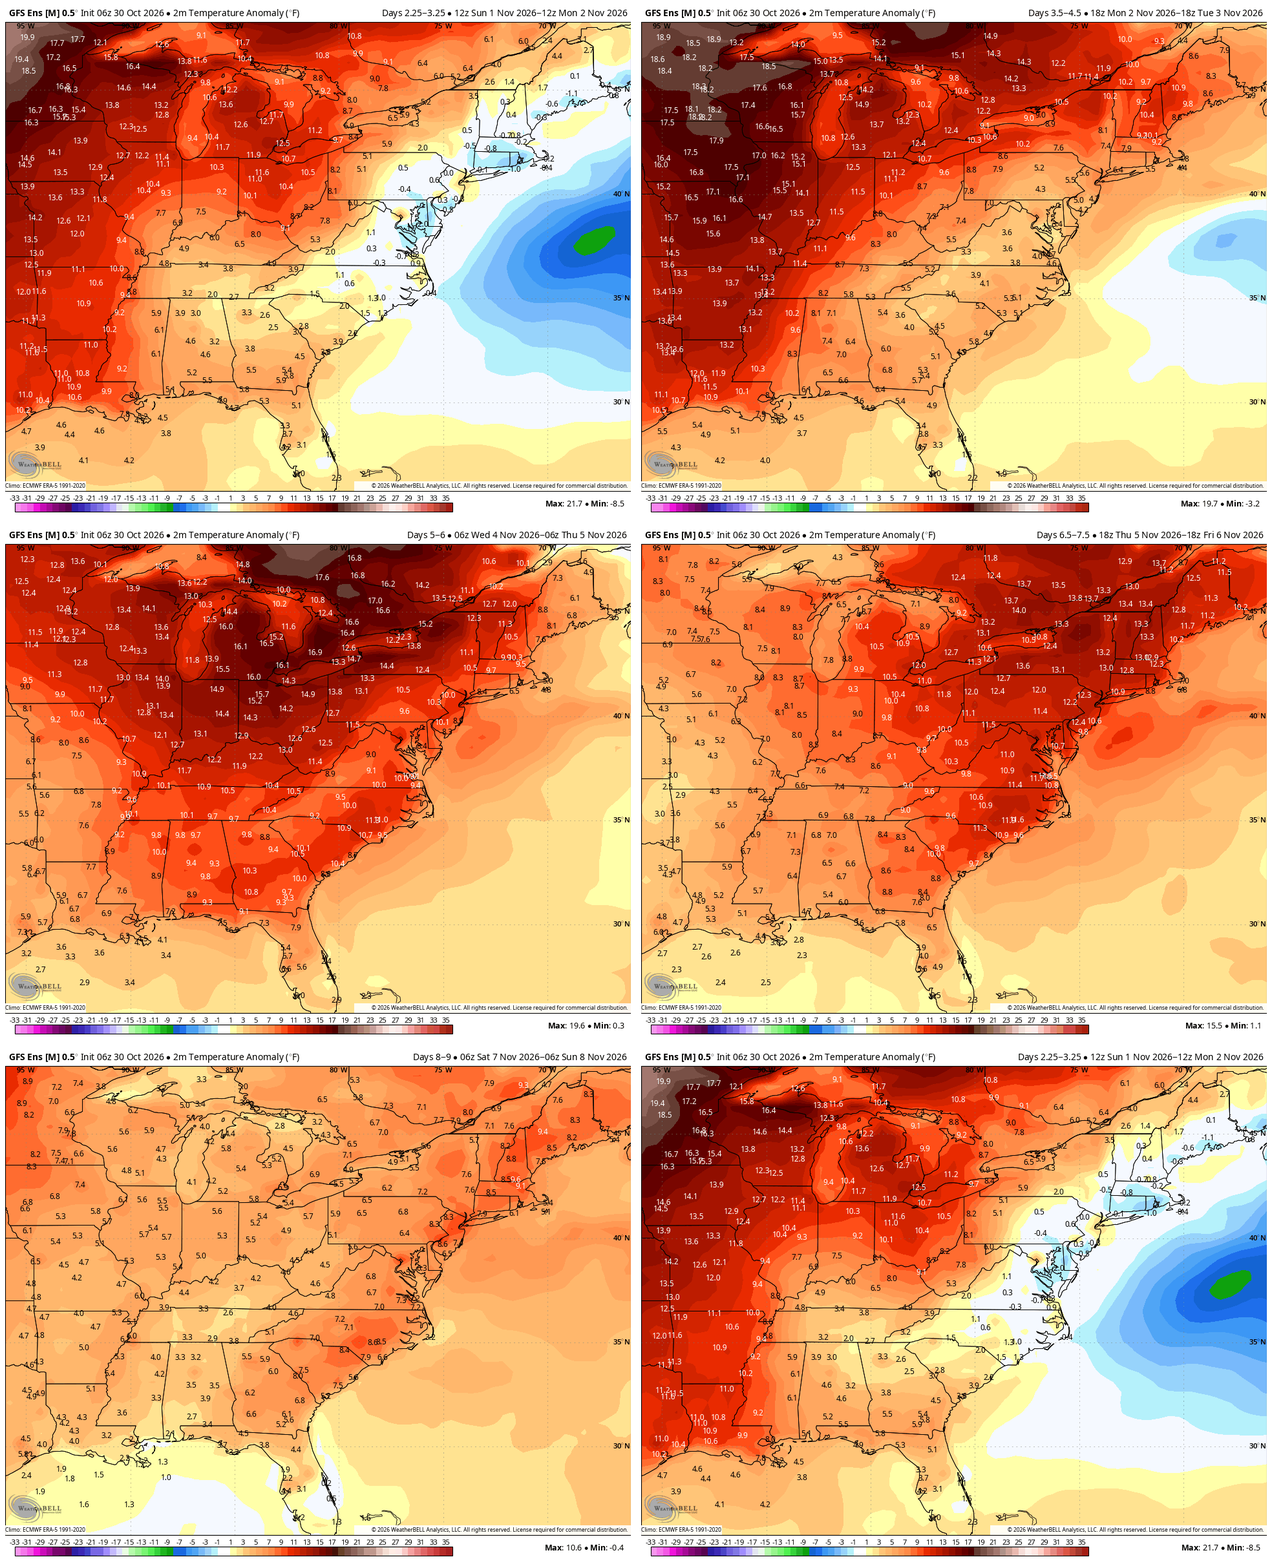
OVERVIEW: November projections were slightly adjusted this week to an above average (+3.0°F to +5.0°F) temperature departure, using long term climate guidance and global observation trends. December temperature projections were slightly adjusted this week for a near to slightly below average (0.0°F to -2.0°F) departure for the month as a whole, largely due to delayed downstream effects from an ongoing Sudden Stratospheric Warming (SSW) event.
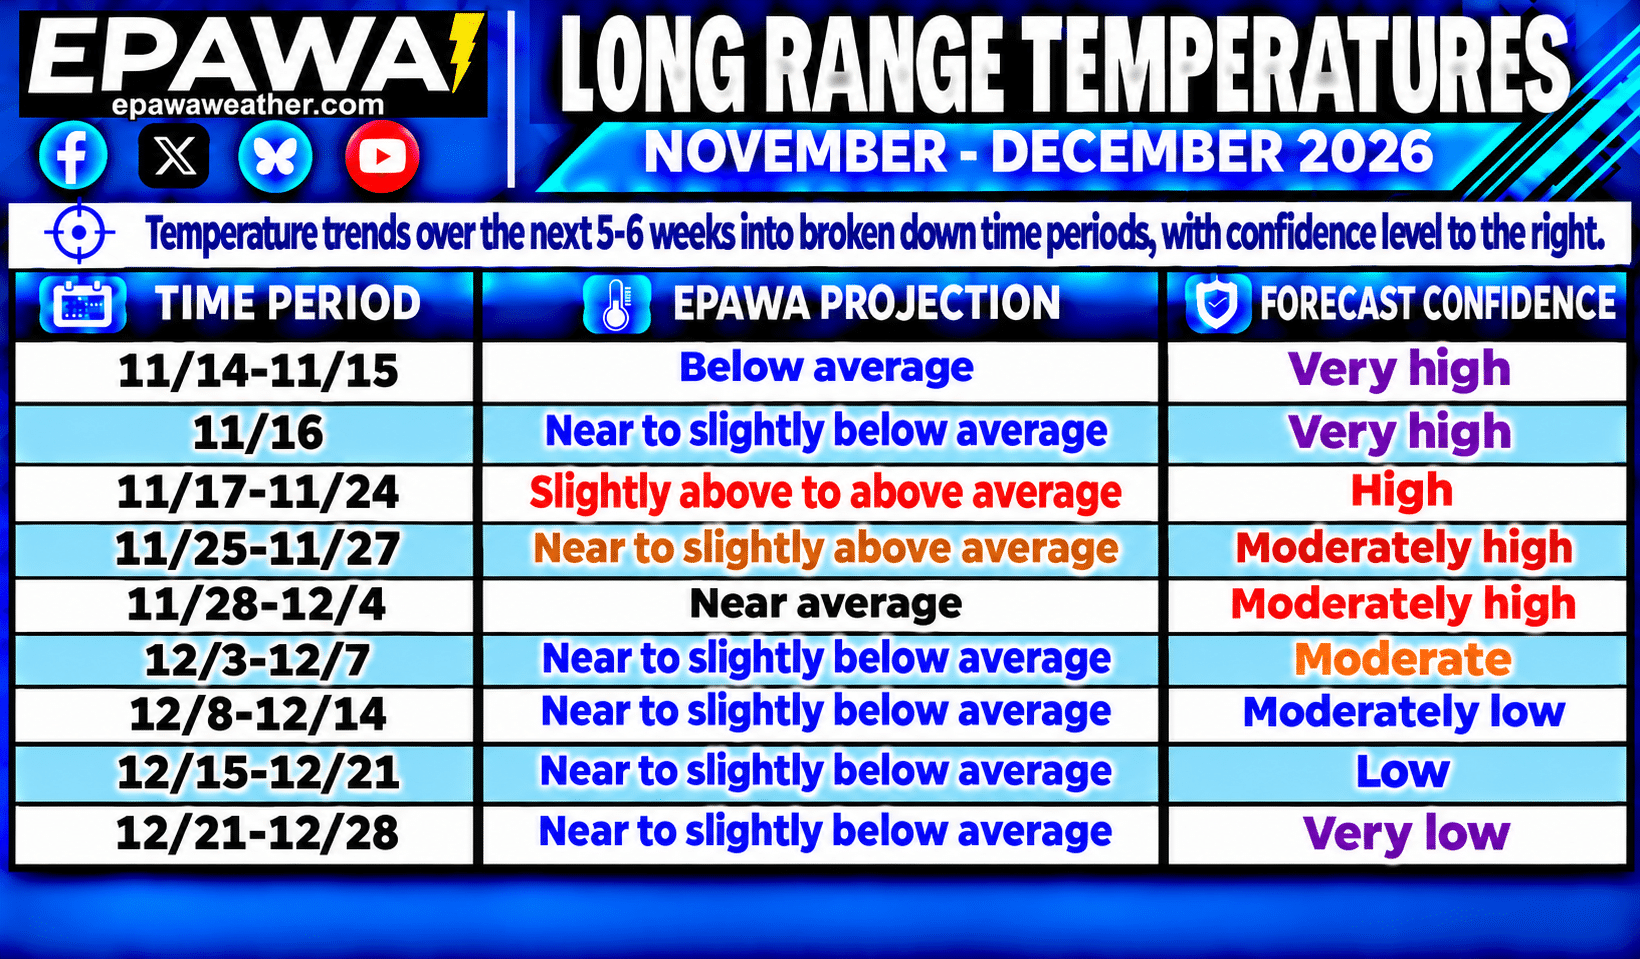
- Seasonal changes are now becoming more noticeable as we continue further into Fall and average highs/lows steadily lower. That downward process is about a 2-3°F drop per week. The expectation for November is for temperatures to be above average as a whole, with most of the remainder of this month fitting that narrative with some shorter-term transient cooler shots mixed in for good measure. A return to near average at the tail end of the month, predicated on the effects of the aforementioned SSW event.
- Sudden Stratospheric Warming (SSW) event: A historically early SSW event is ongoing, and a zonal wind reversal at 10 hPa did in fact occur over the past few days. Indications are that this could have at least some implications on our sensible weather pattern to begin December depending on several factors, including how it couples with the troposphere, and what area(s) within the Northern Hemisphere the cooler anomalies most affect. The weak Stratospheric Polar Vortex will likely consolidate and recover rather quickly over the polar regions in late November, and may become exceptionally strong following the disruption. We continue to feel that there will be at least some local effects in December, and perhaps an early season snow event or event(s).
- The Madden-Julian Oscillation (MJO) is currently in phase 3 (Indian Ocean) and is expected to move into the Circle of Death (COD) or NULL phase to begin the 3rd week of November. With time and to begin December, Western Pacific tropical forcing west of the International Dateline may lead to a colder/stormier stretch as we move further into December, especially beyond mid-month. Hurricane activity is coming to an end soon, with Atlantic hurricane season ending November 30th.
- A composite average of the Sea Surface Temperature Anomalies (SSTa) in the ENSO regions places it in very strong El Niño territory currently. The following are Coral Reef Watch Sea Surface Temperature Anomaly values found at https://cyclonicwx.com/sst/ are referenced in this context. From west to east across the Pacific, the Niño 4 (west-central Pacific) is currently the “coolest” region at +1.3°C, whereas the Niño 3.4 region (east-central Pacific) is currently at +3.2°C. The eastern regions of Niño 3 (east-central Pacific) is currently +4.3°C, and Niño 1+2 region (near the Peruvian coast) is at an astounding +5.9°C as of November 12th. A near-record strong El Niño Fall is likely to continue and peak this month, and is currently an East-based El Niño. Recently the upside strength of this east-based El Niño has leveled off and has been maintaining.
Average high temperatures are currently in the 52-59°F range from north to south across our coverage region, which is about 2-3°F lower than at this point last week. The drop off in temps will continue throughout Fall at about a 2-3°F per week drop. Any above or below average stretches listed in the outlook will be relative to seasonal norms at that time, and it is important to understand that cooler/warmer periods will be relative to the time of year. For example, the slightly above to above average temperatures listed in the November 17th-24th period features highs in the upper 50s to middle 60s, coming at a time when average highs are in the lower to middle 50s. Use the average highs/lows chart below providing transparency for what average temperatures are at each corresponding location through December 31st.
Note: Any image below is clickable for larger viewing
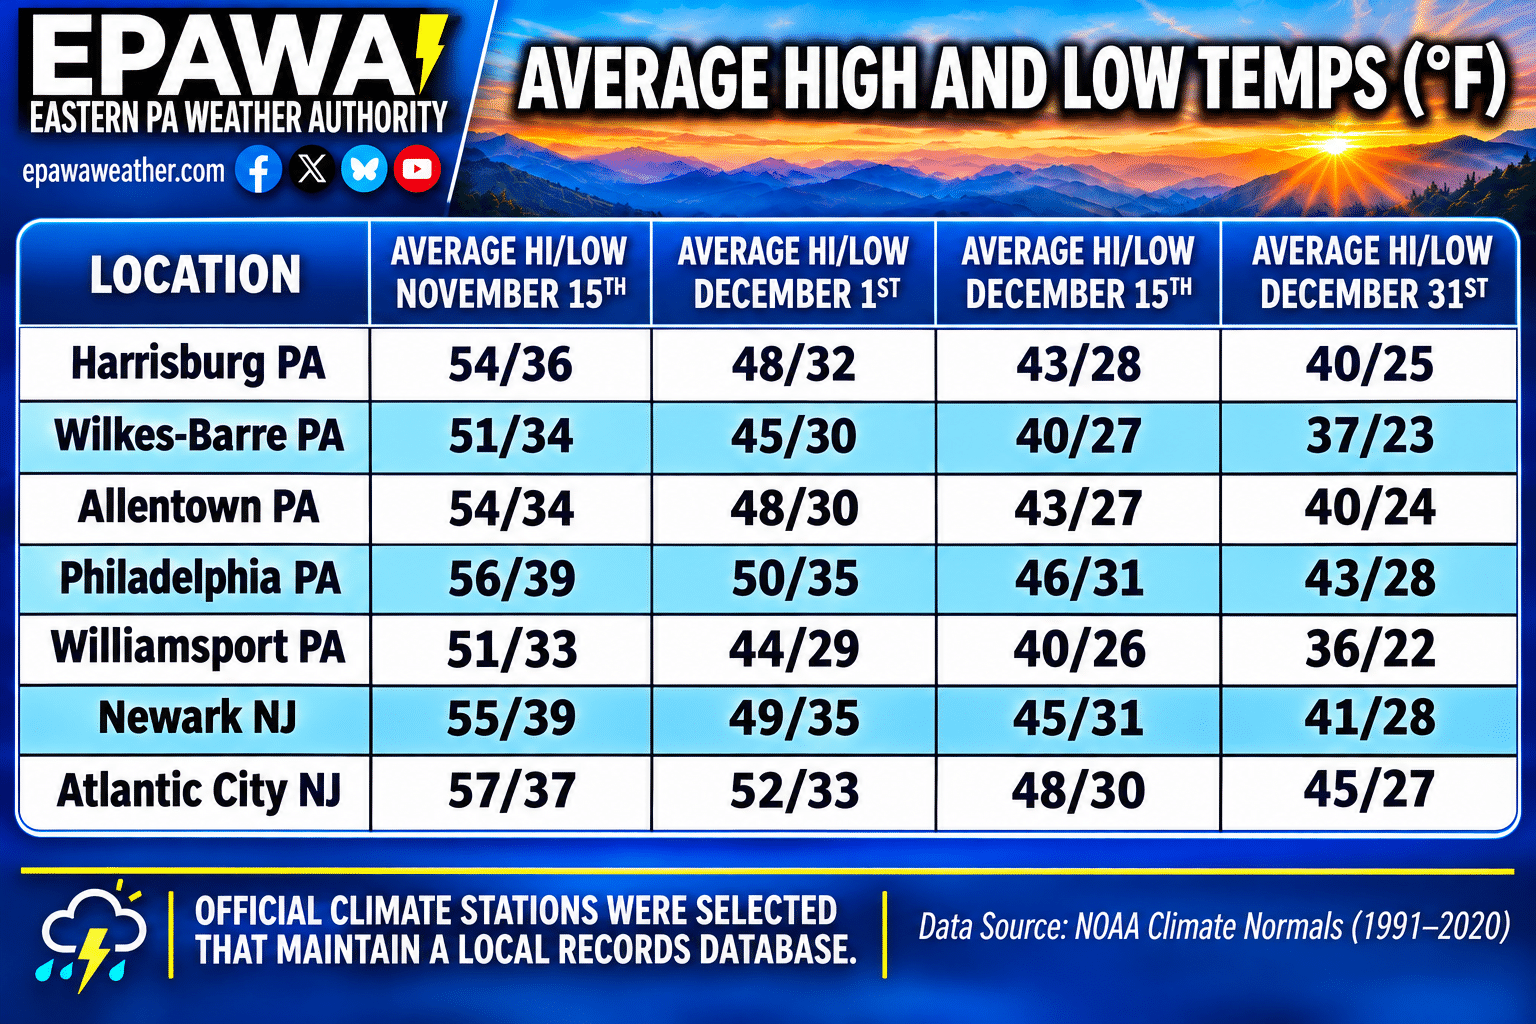
Average temperatures at our major climates stations across the region are shown over the next 6 weeks; average temps will drop at a much faster rate of 2-3°F per week through Fall.
EPAWA's Long Range Projections
Projections last updated: November 13th; next scheduled update: November 20th
Climate Prediction Center Products
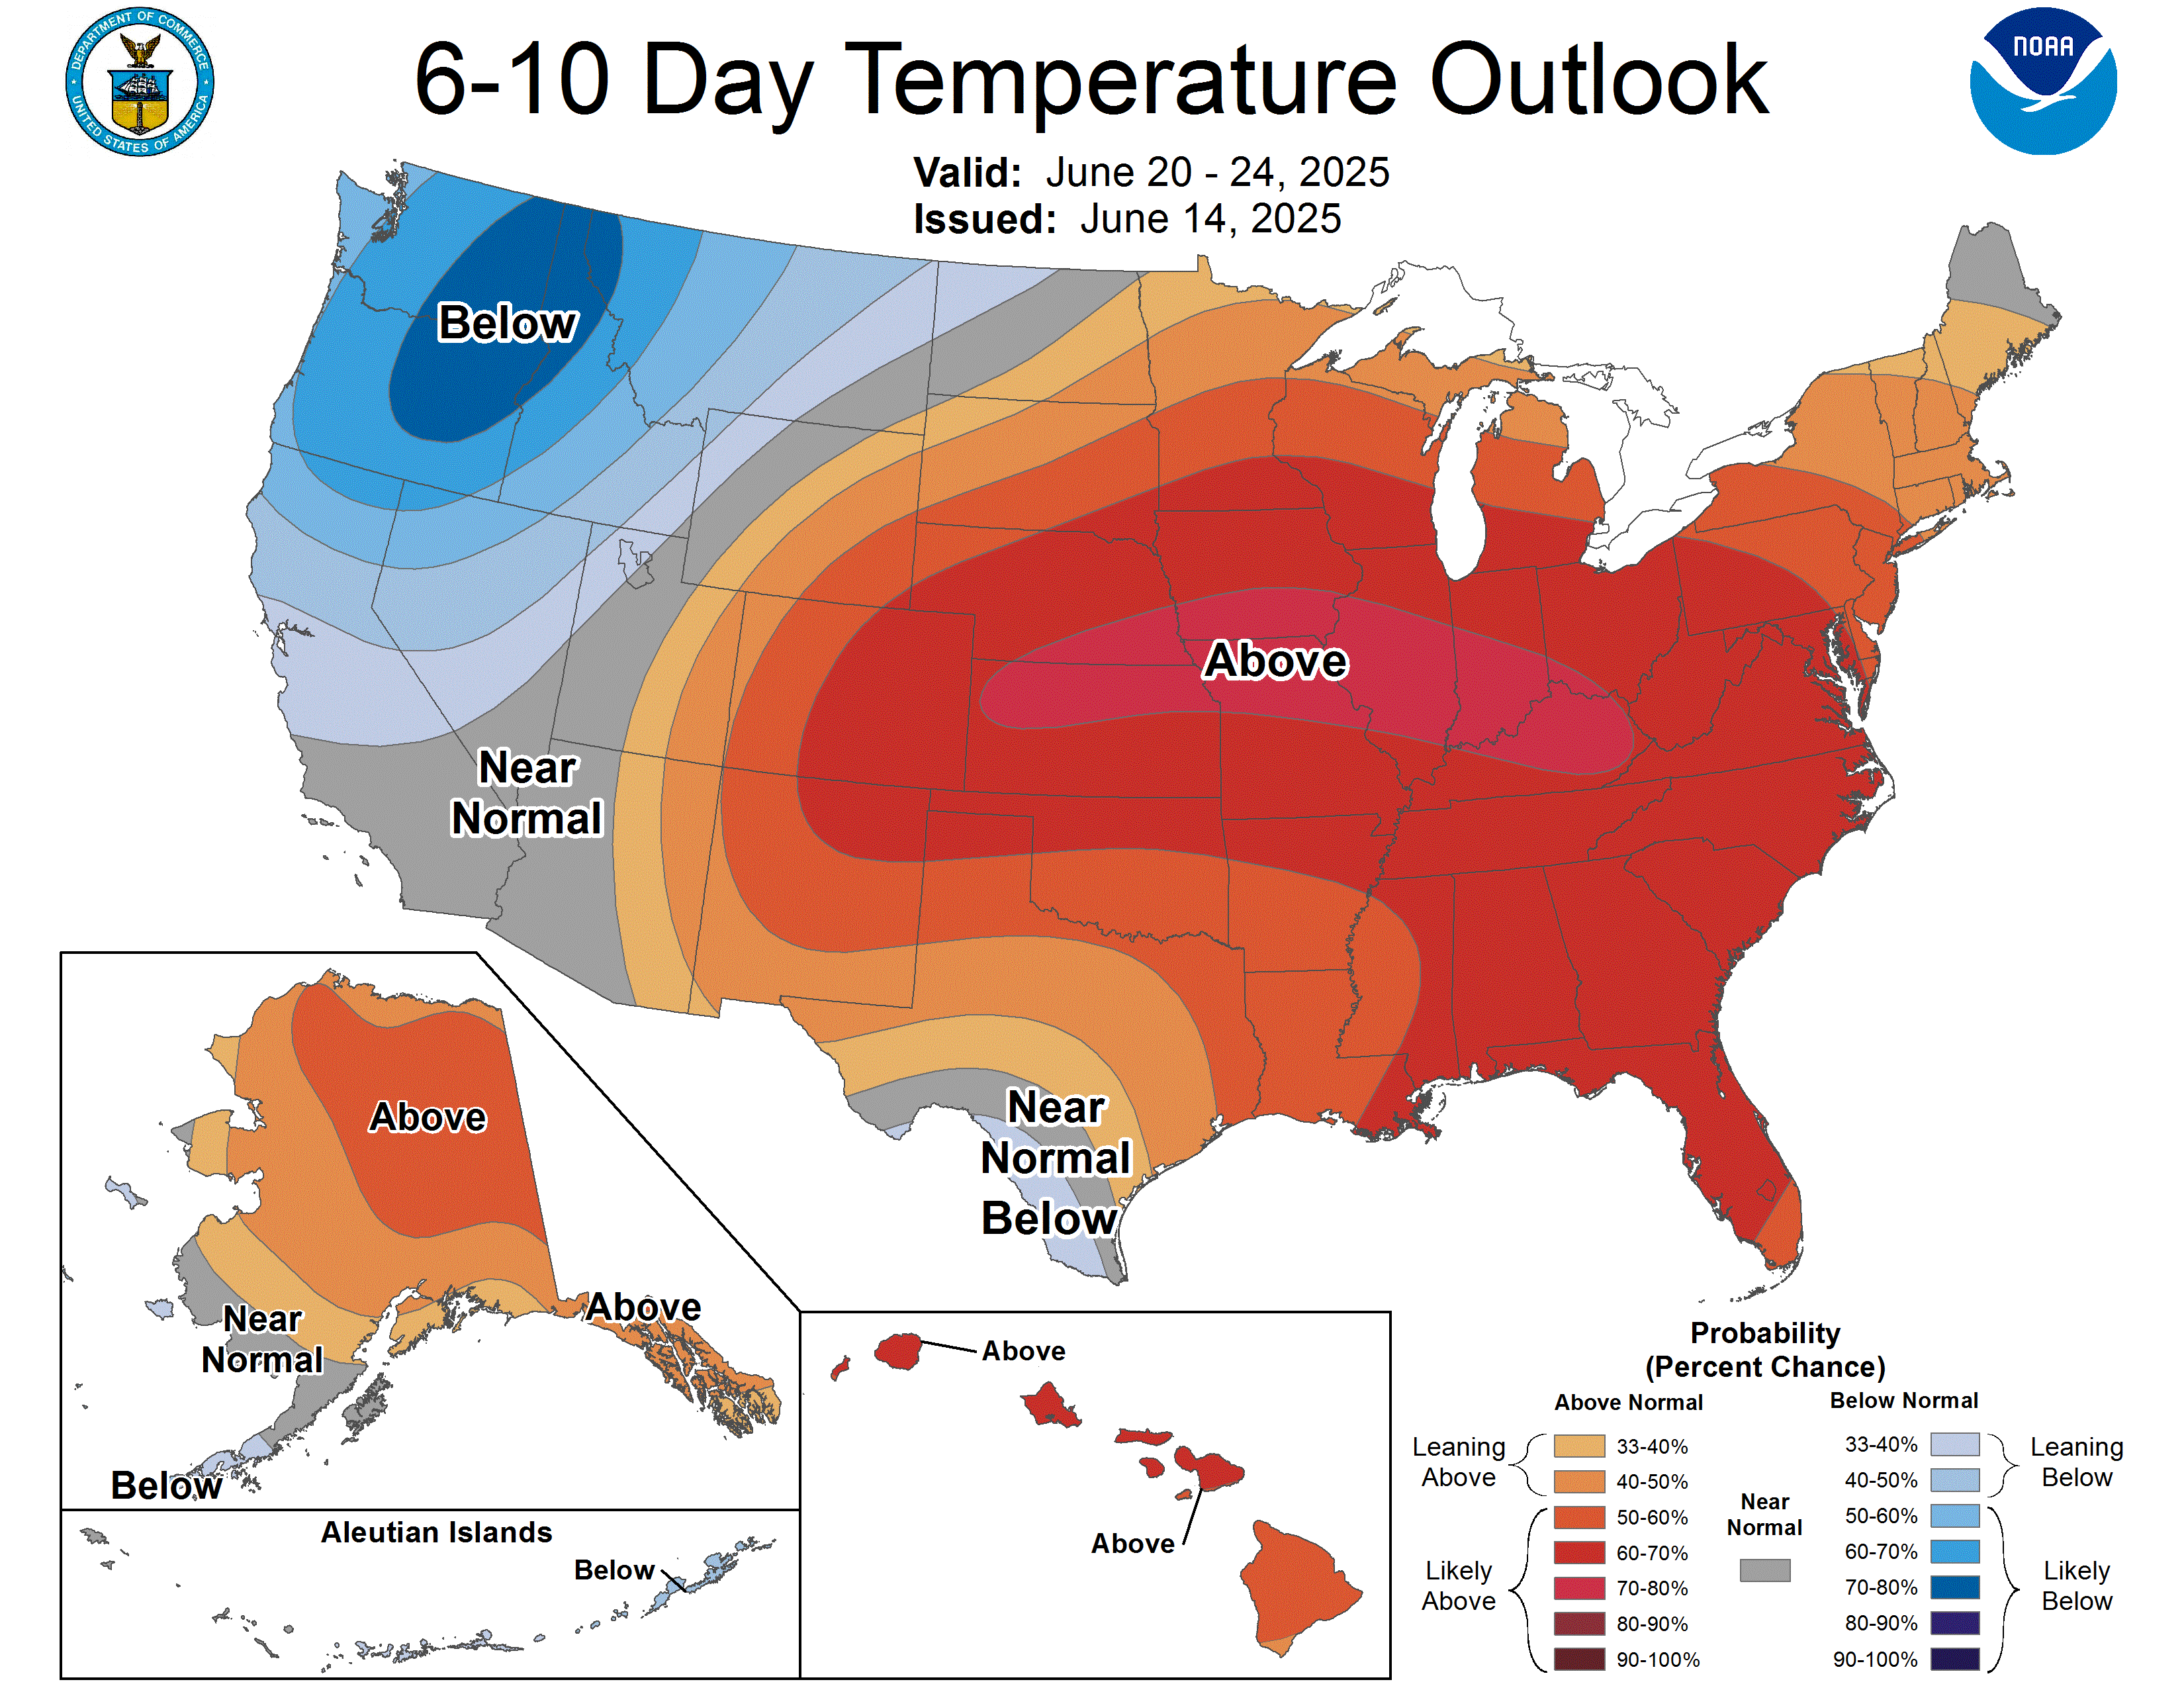
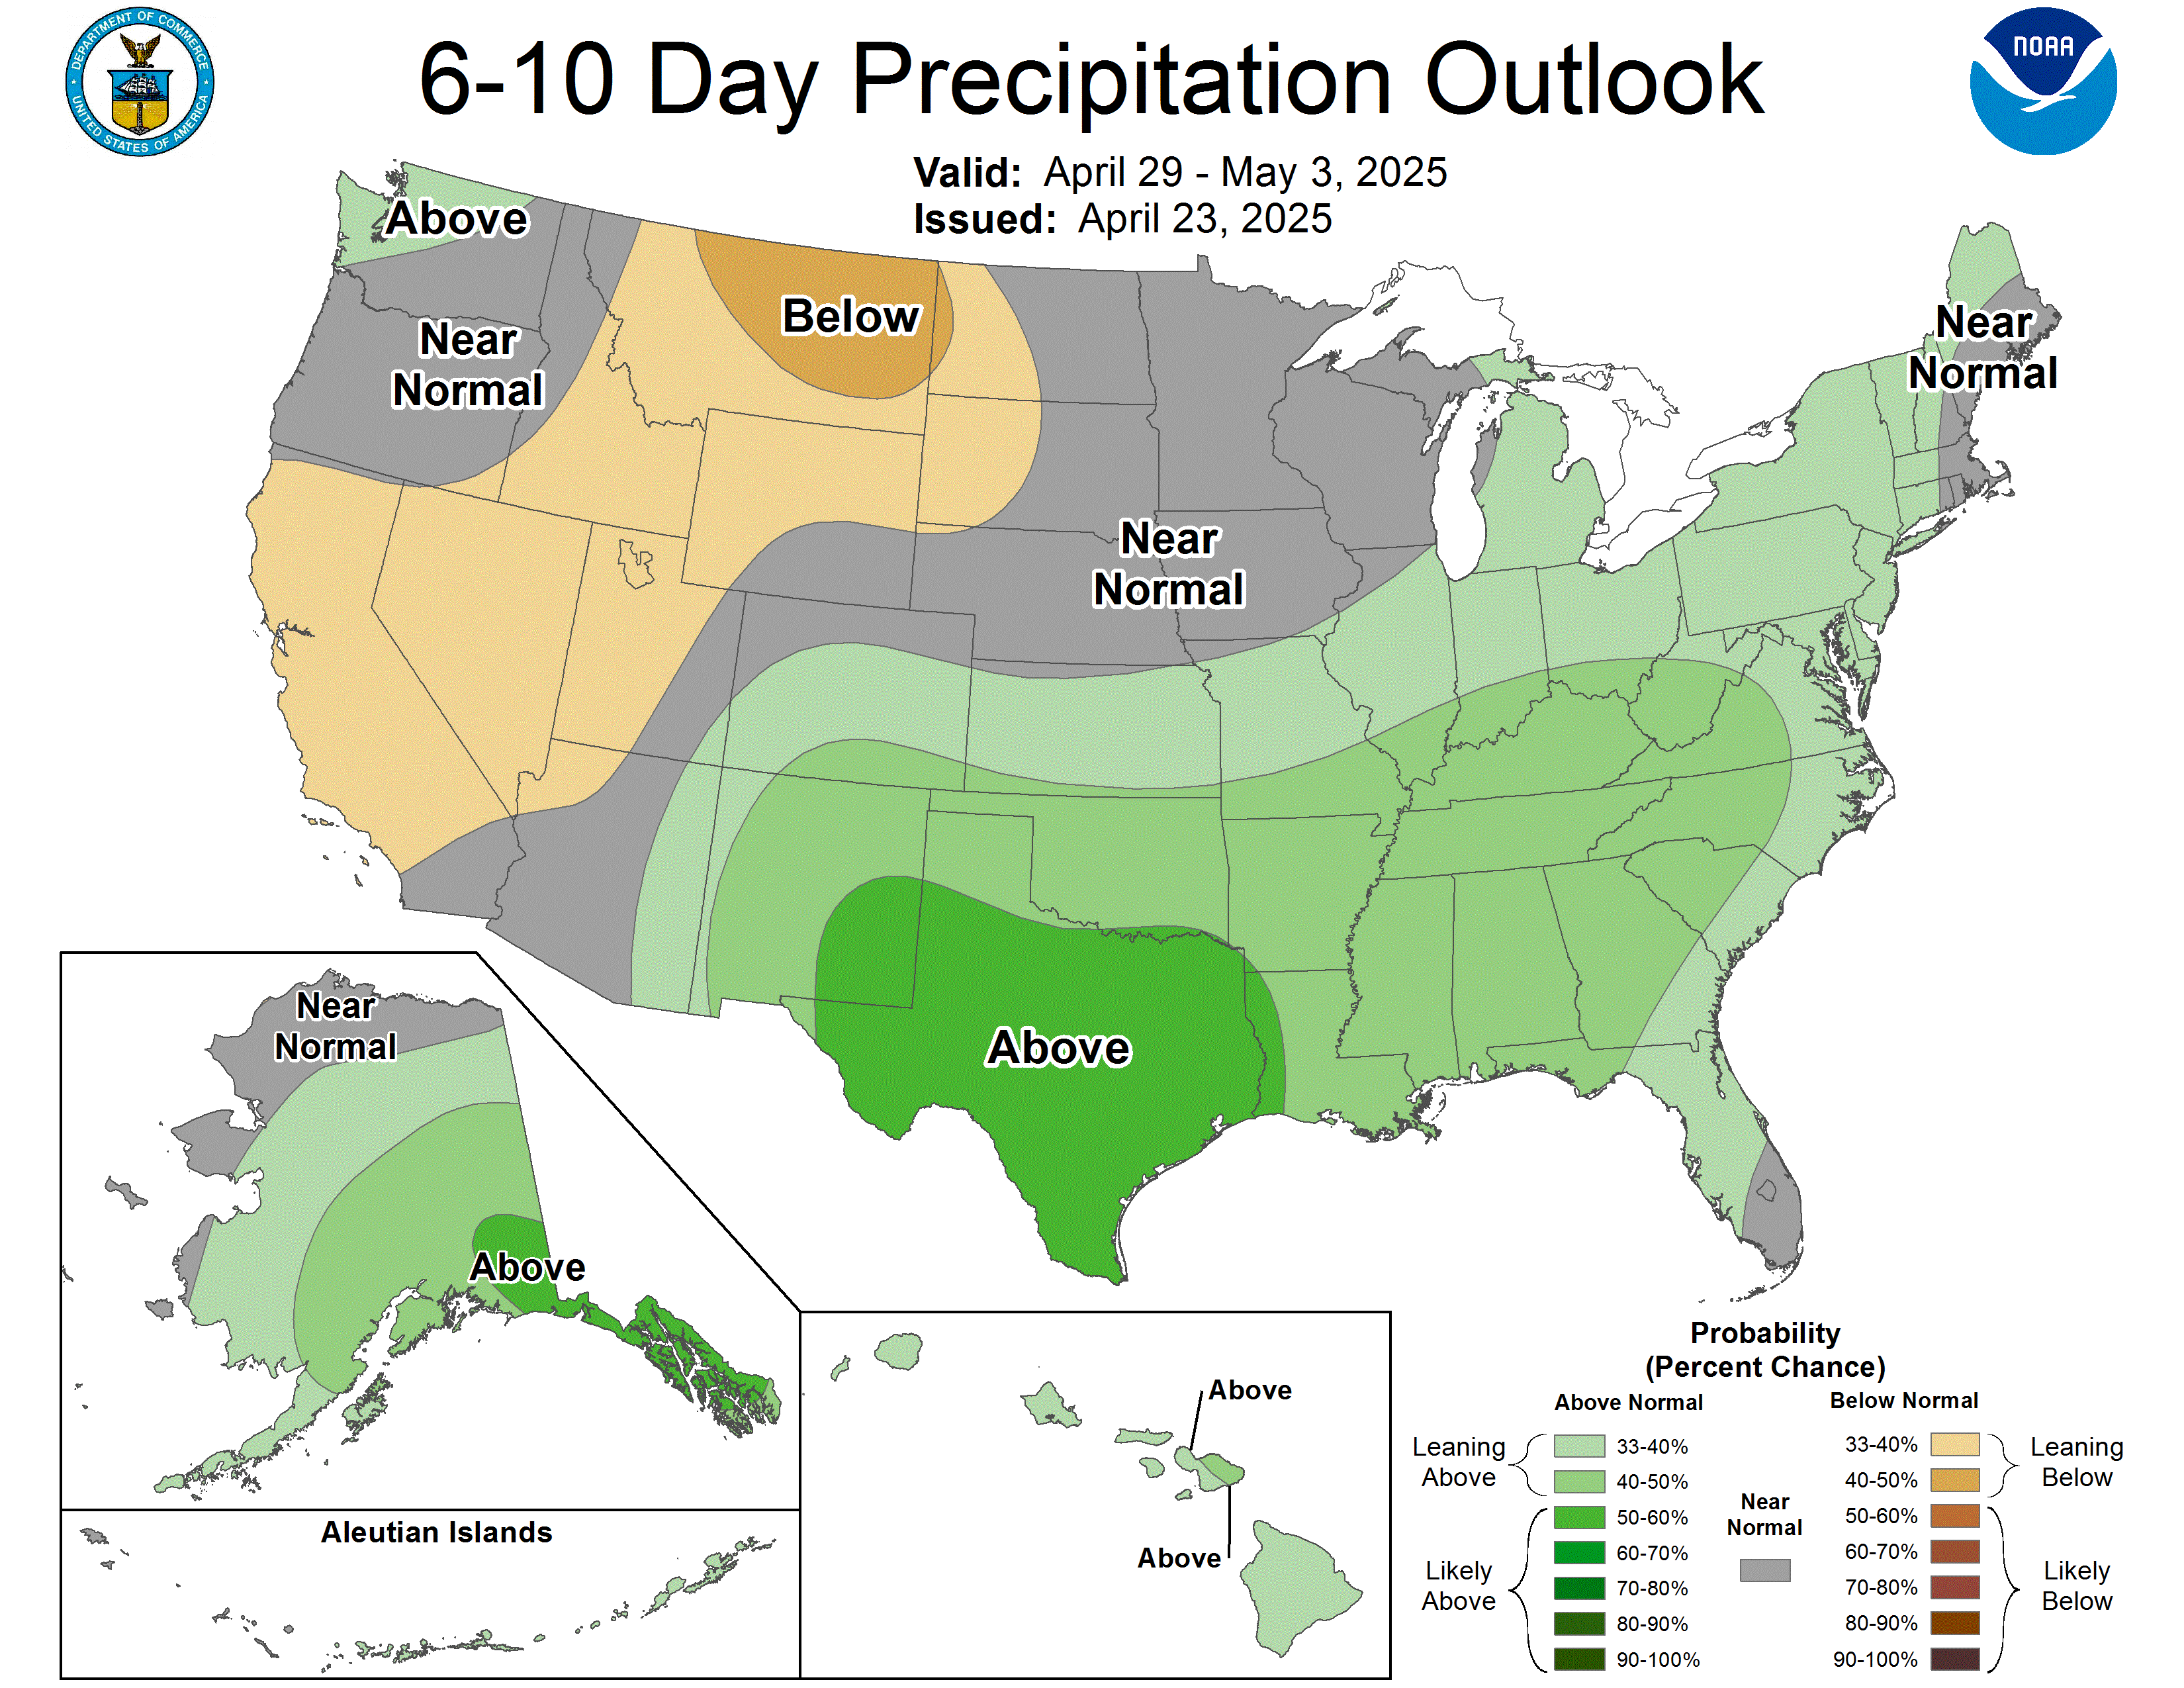
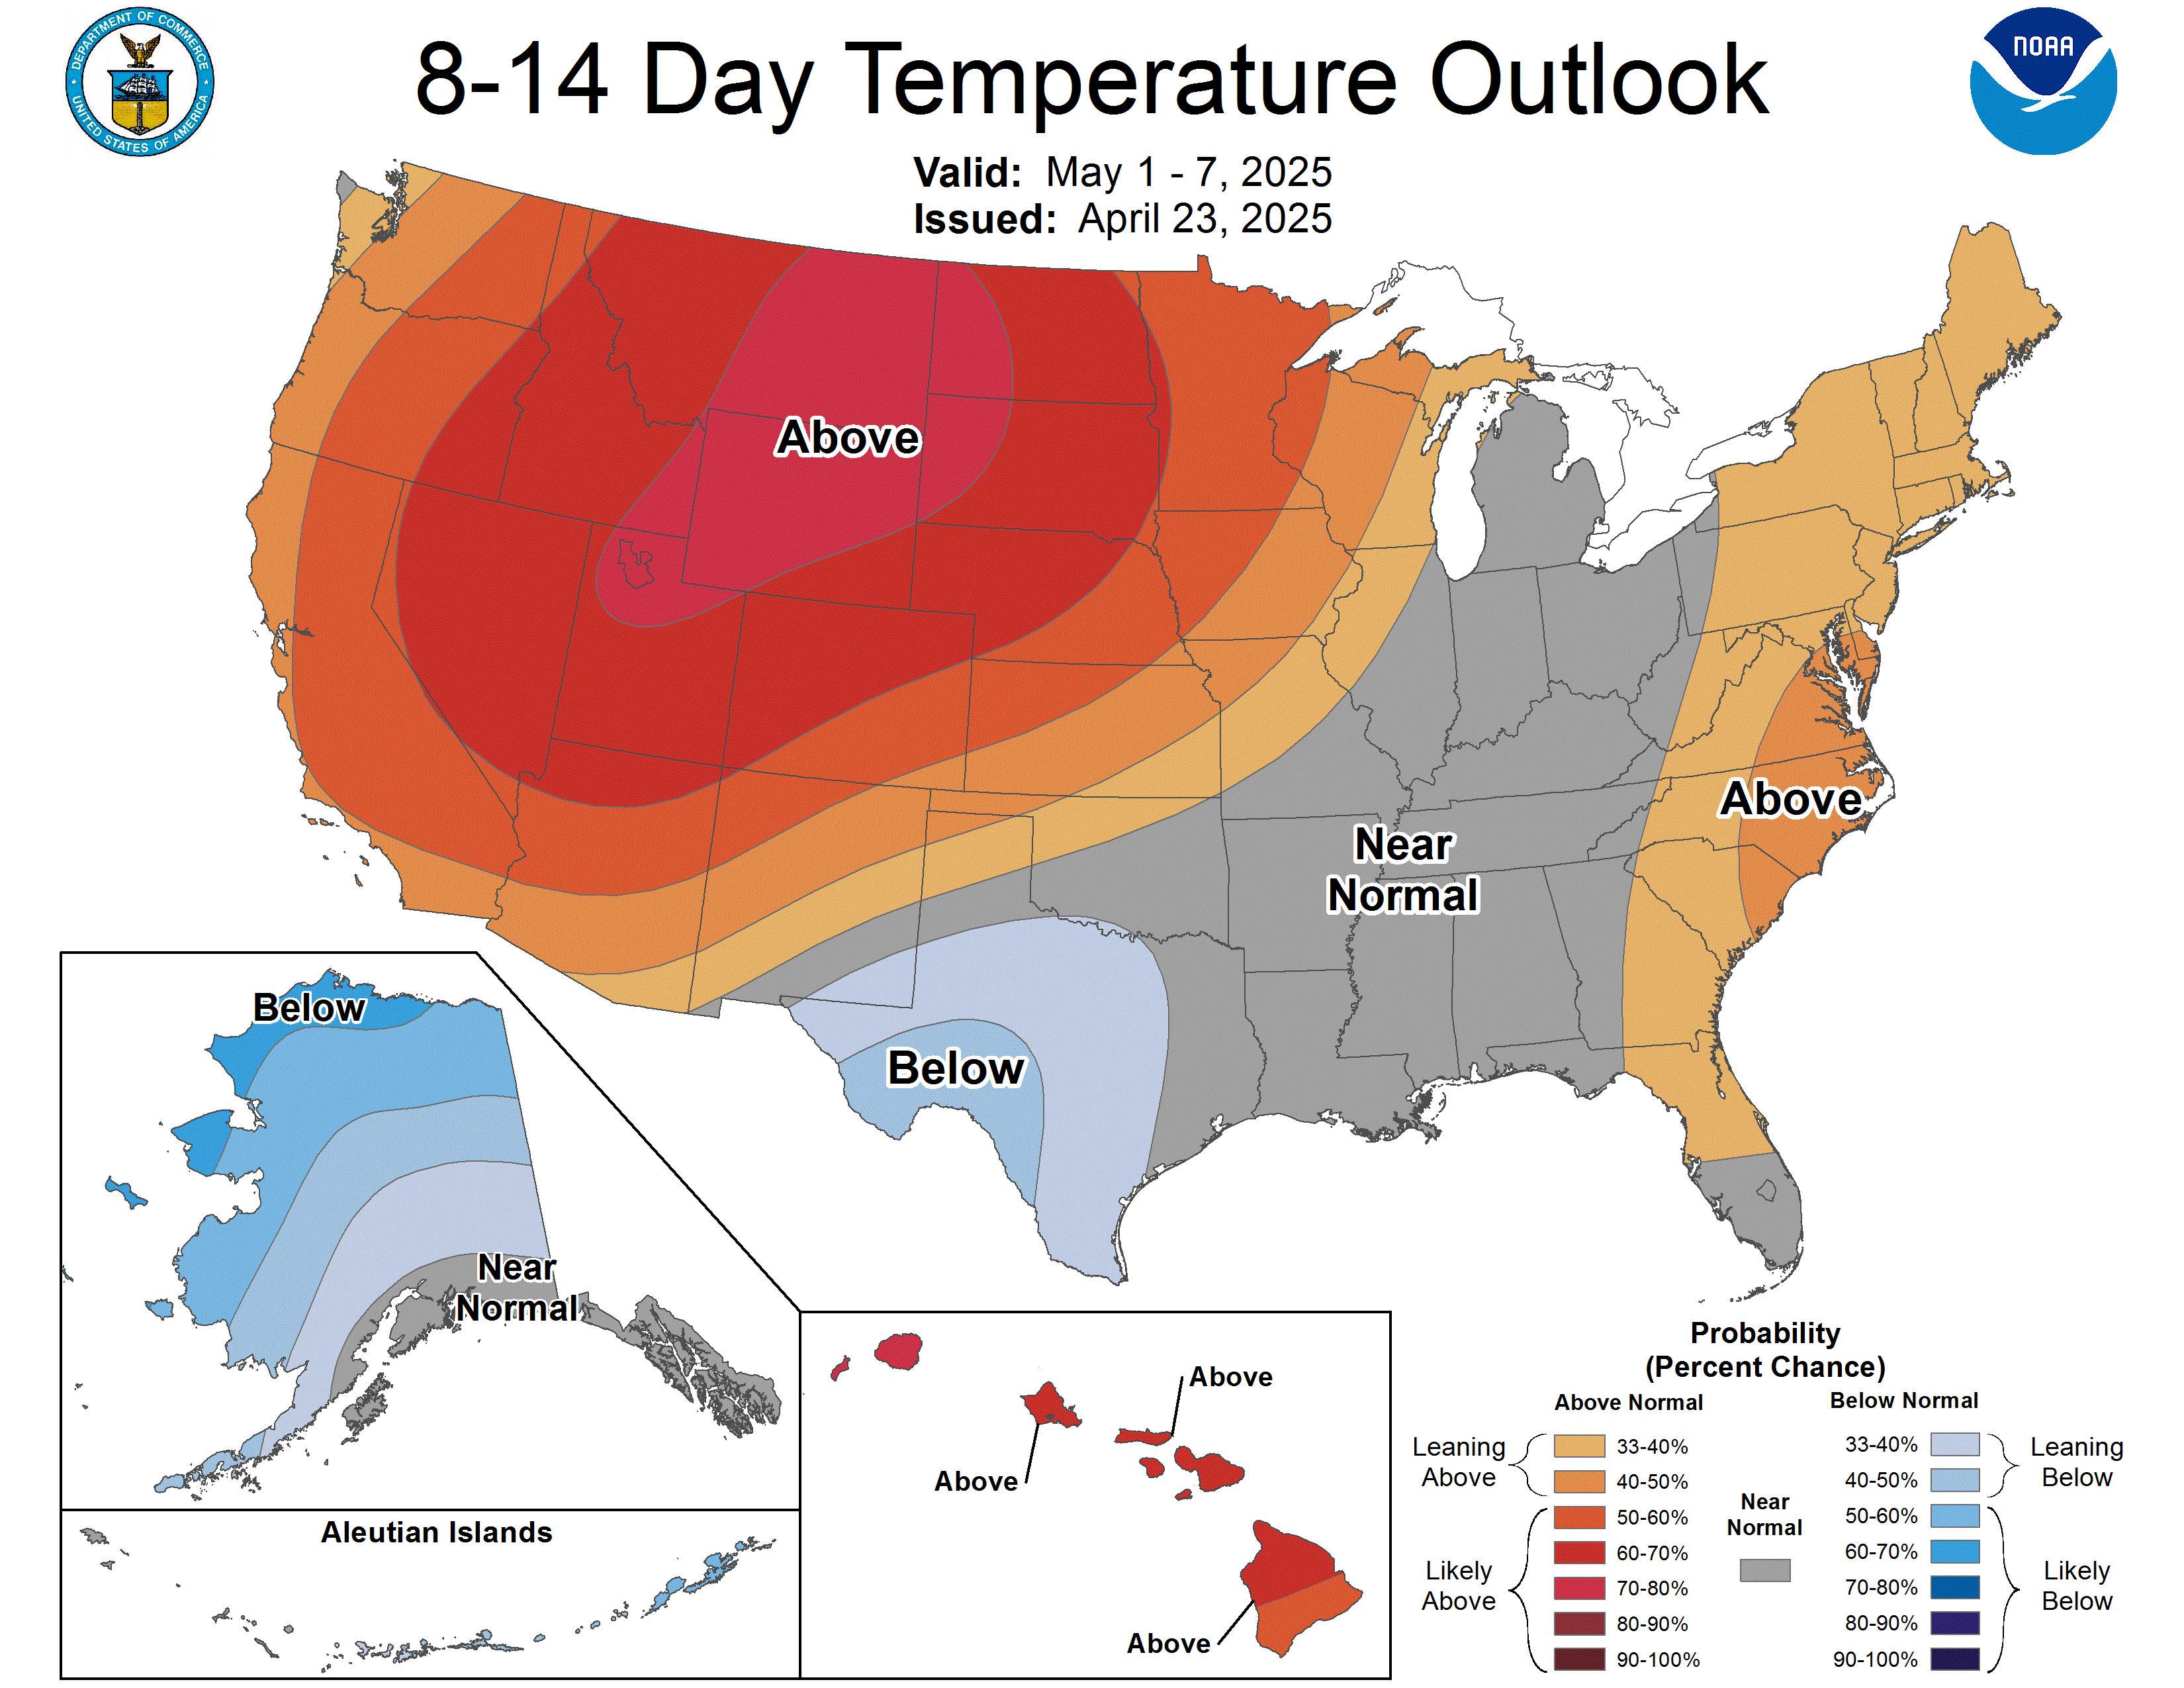
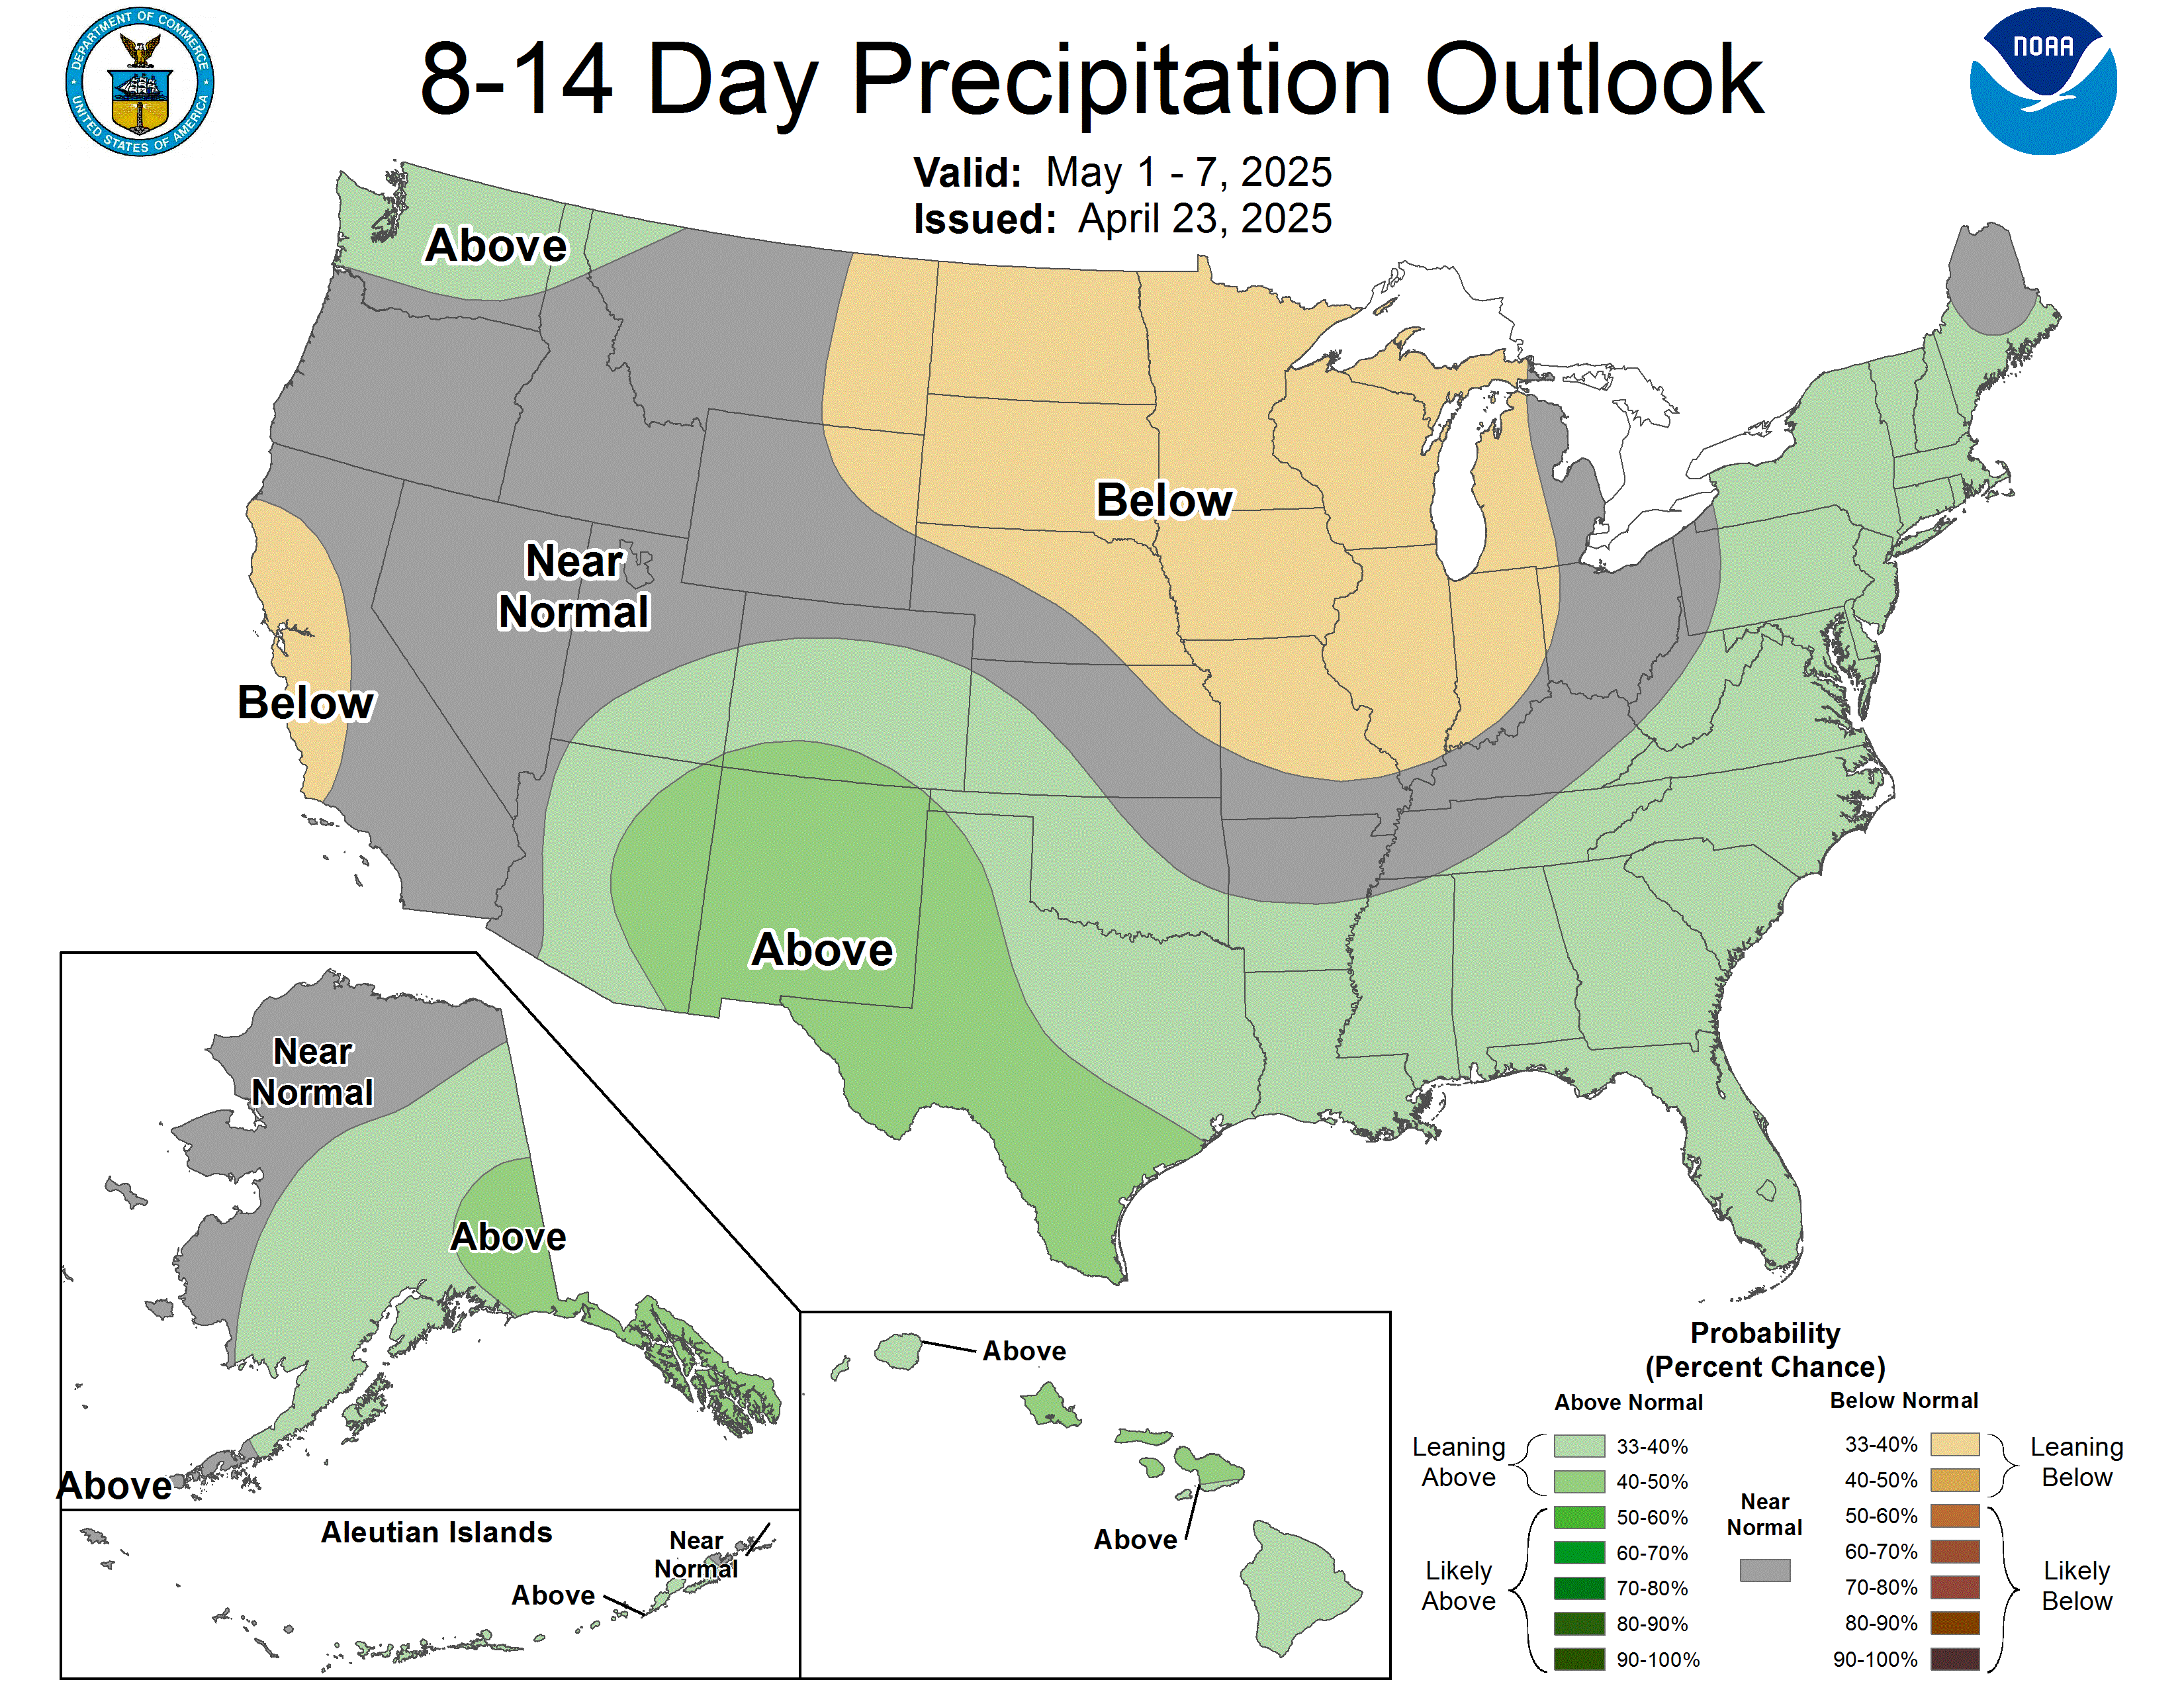
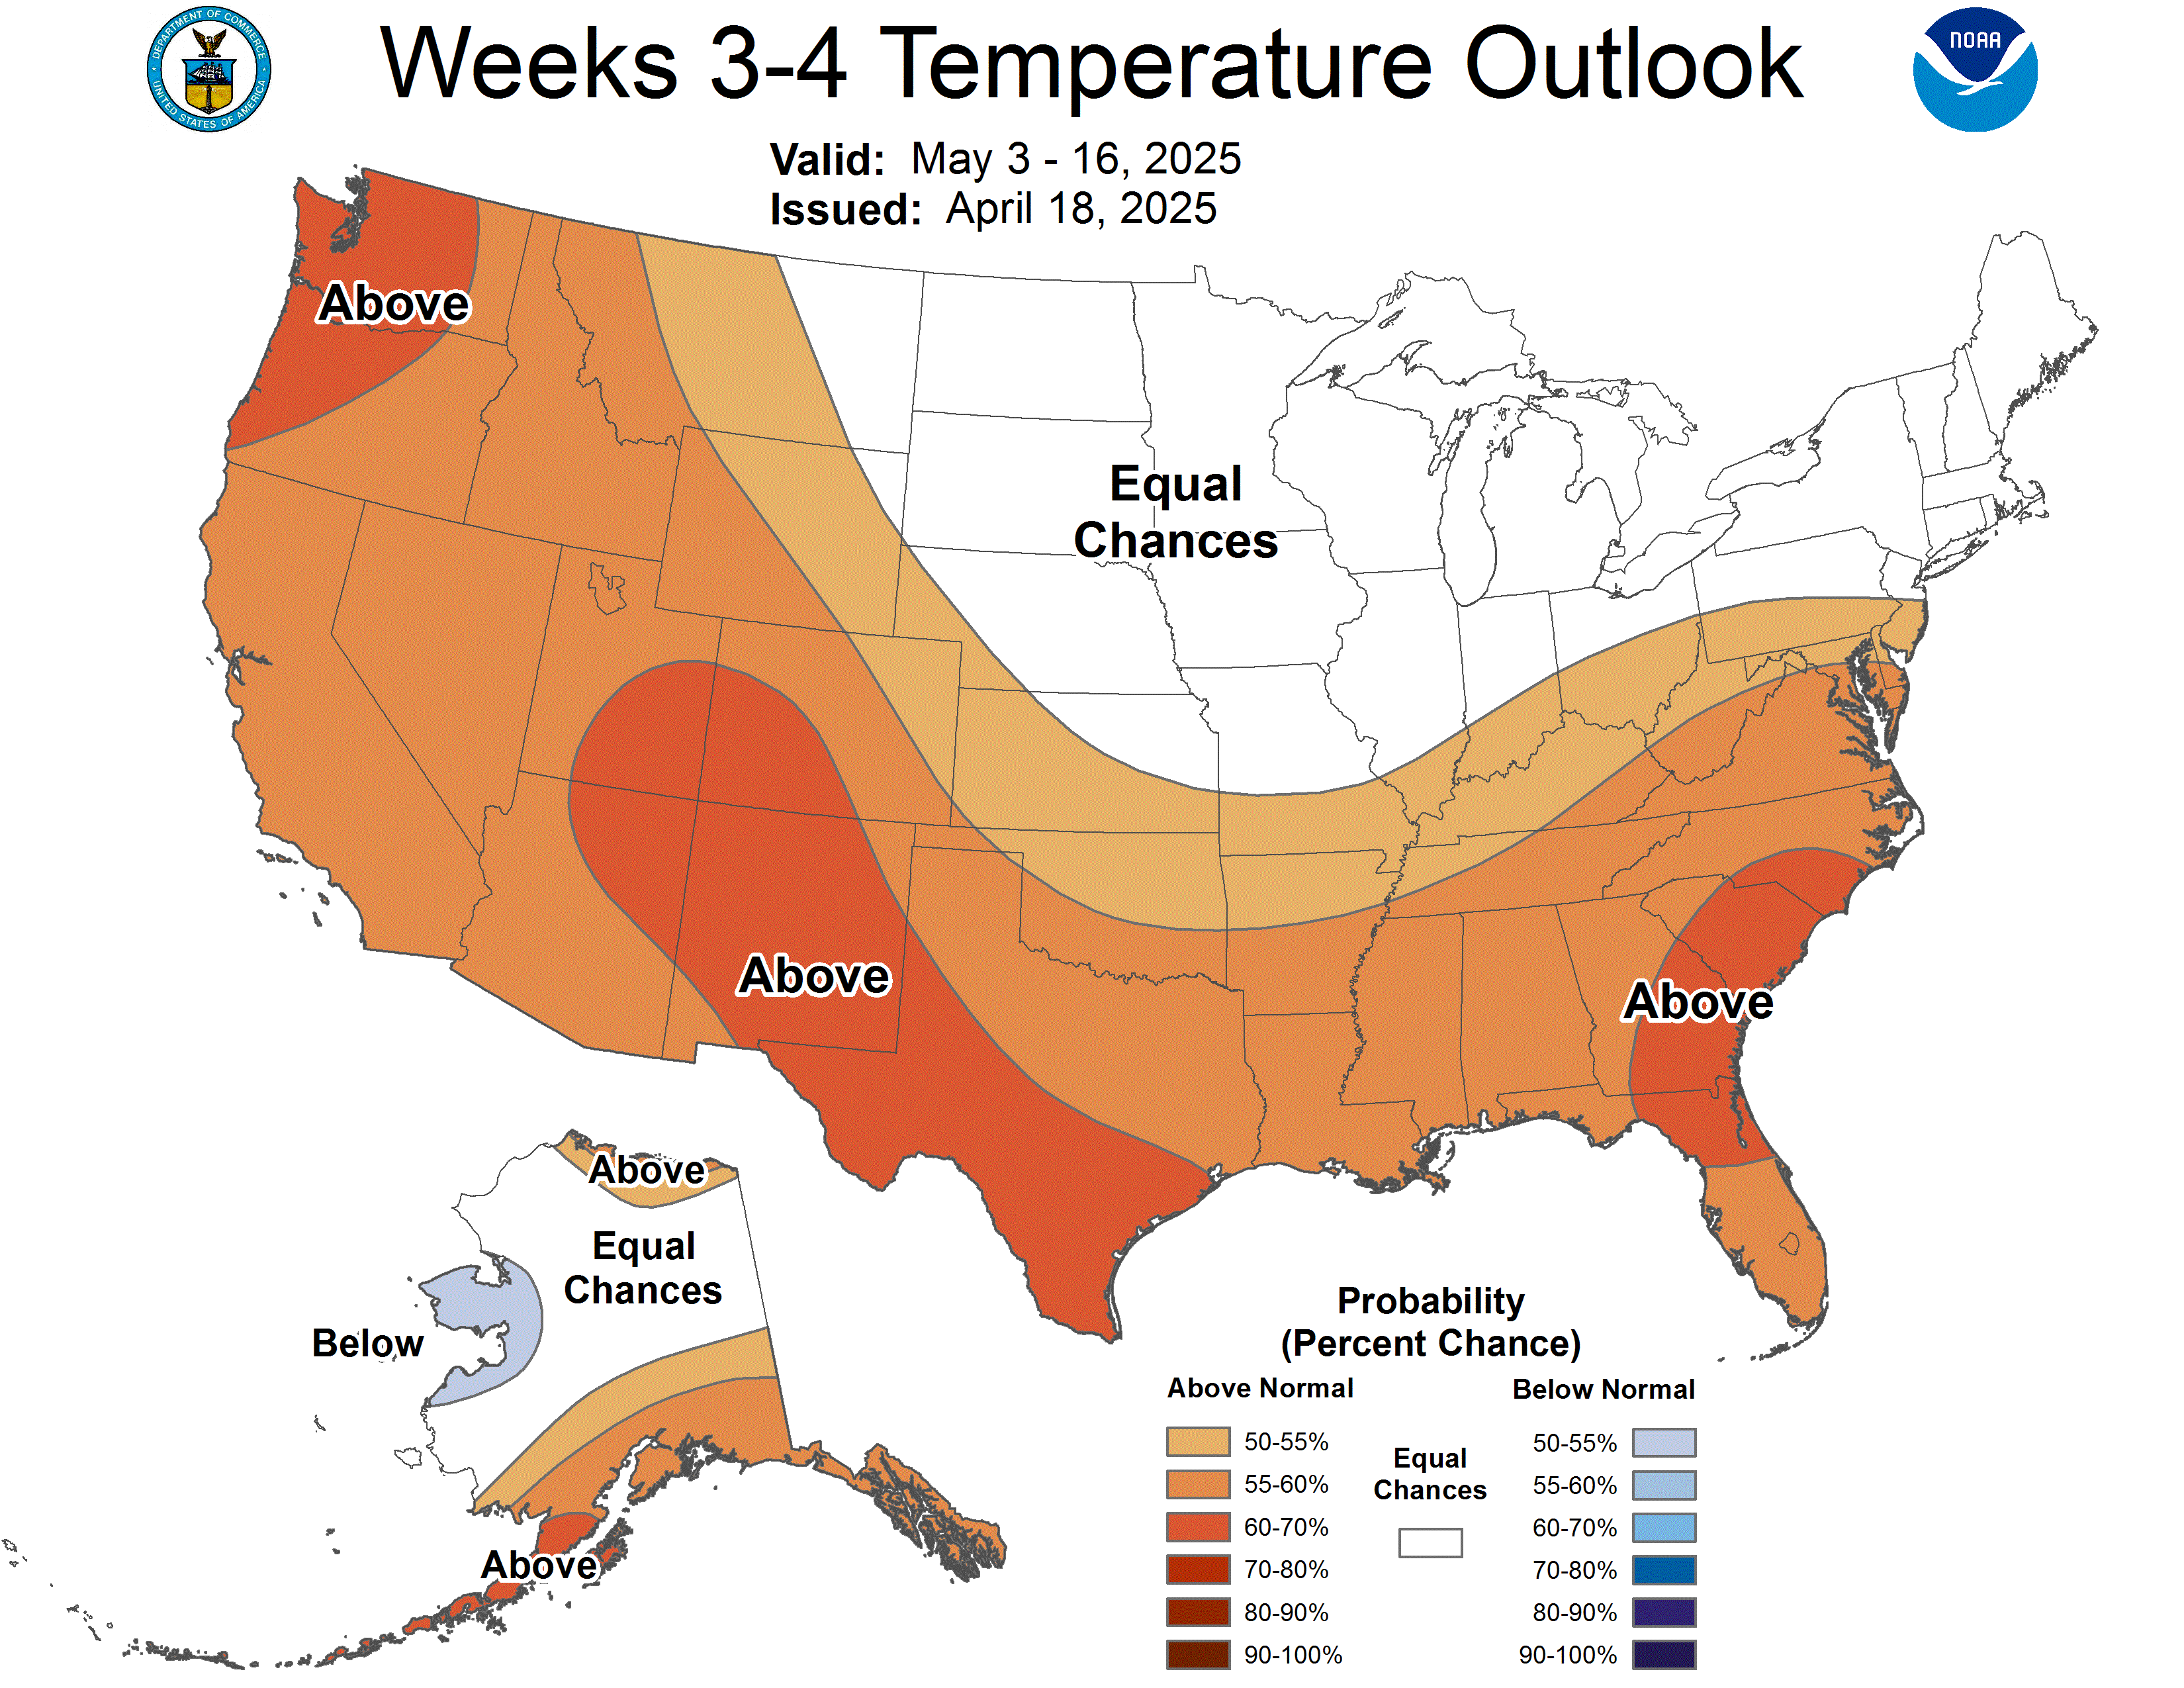
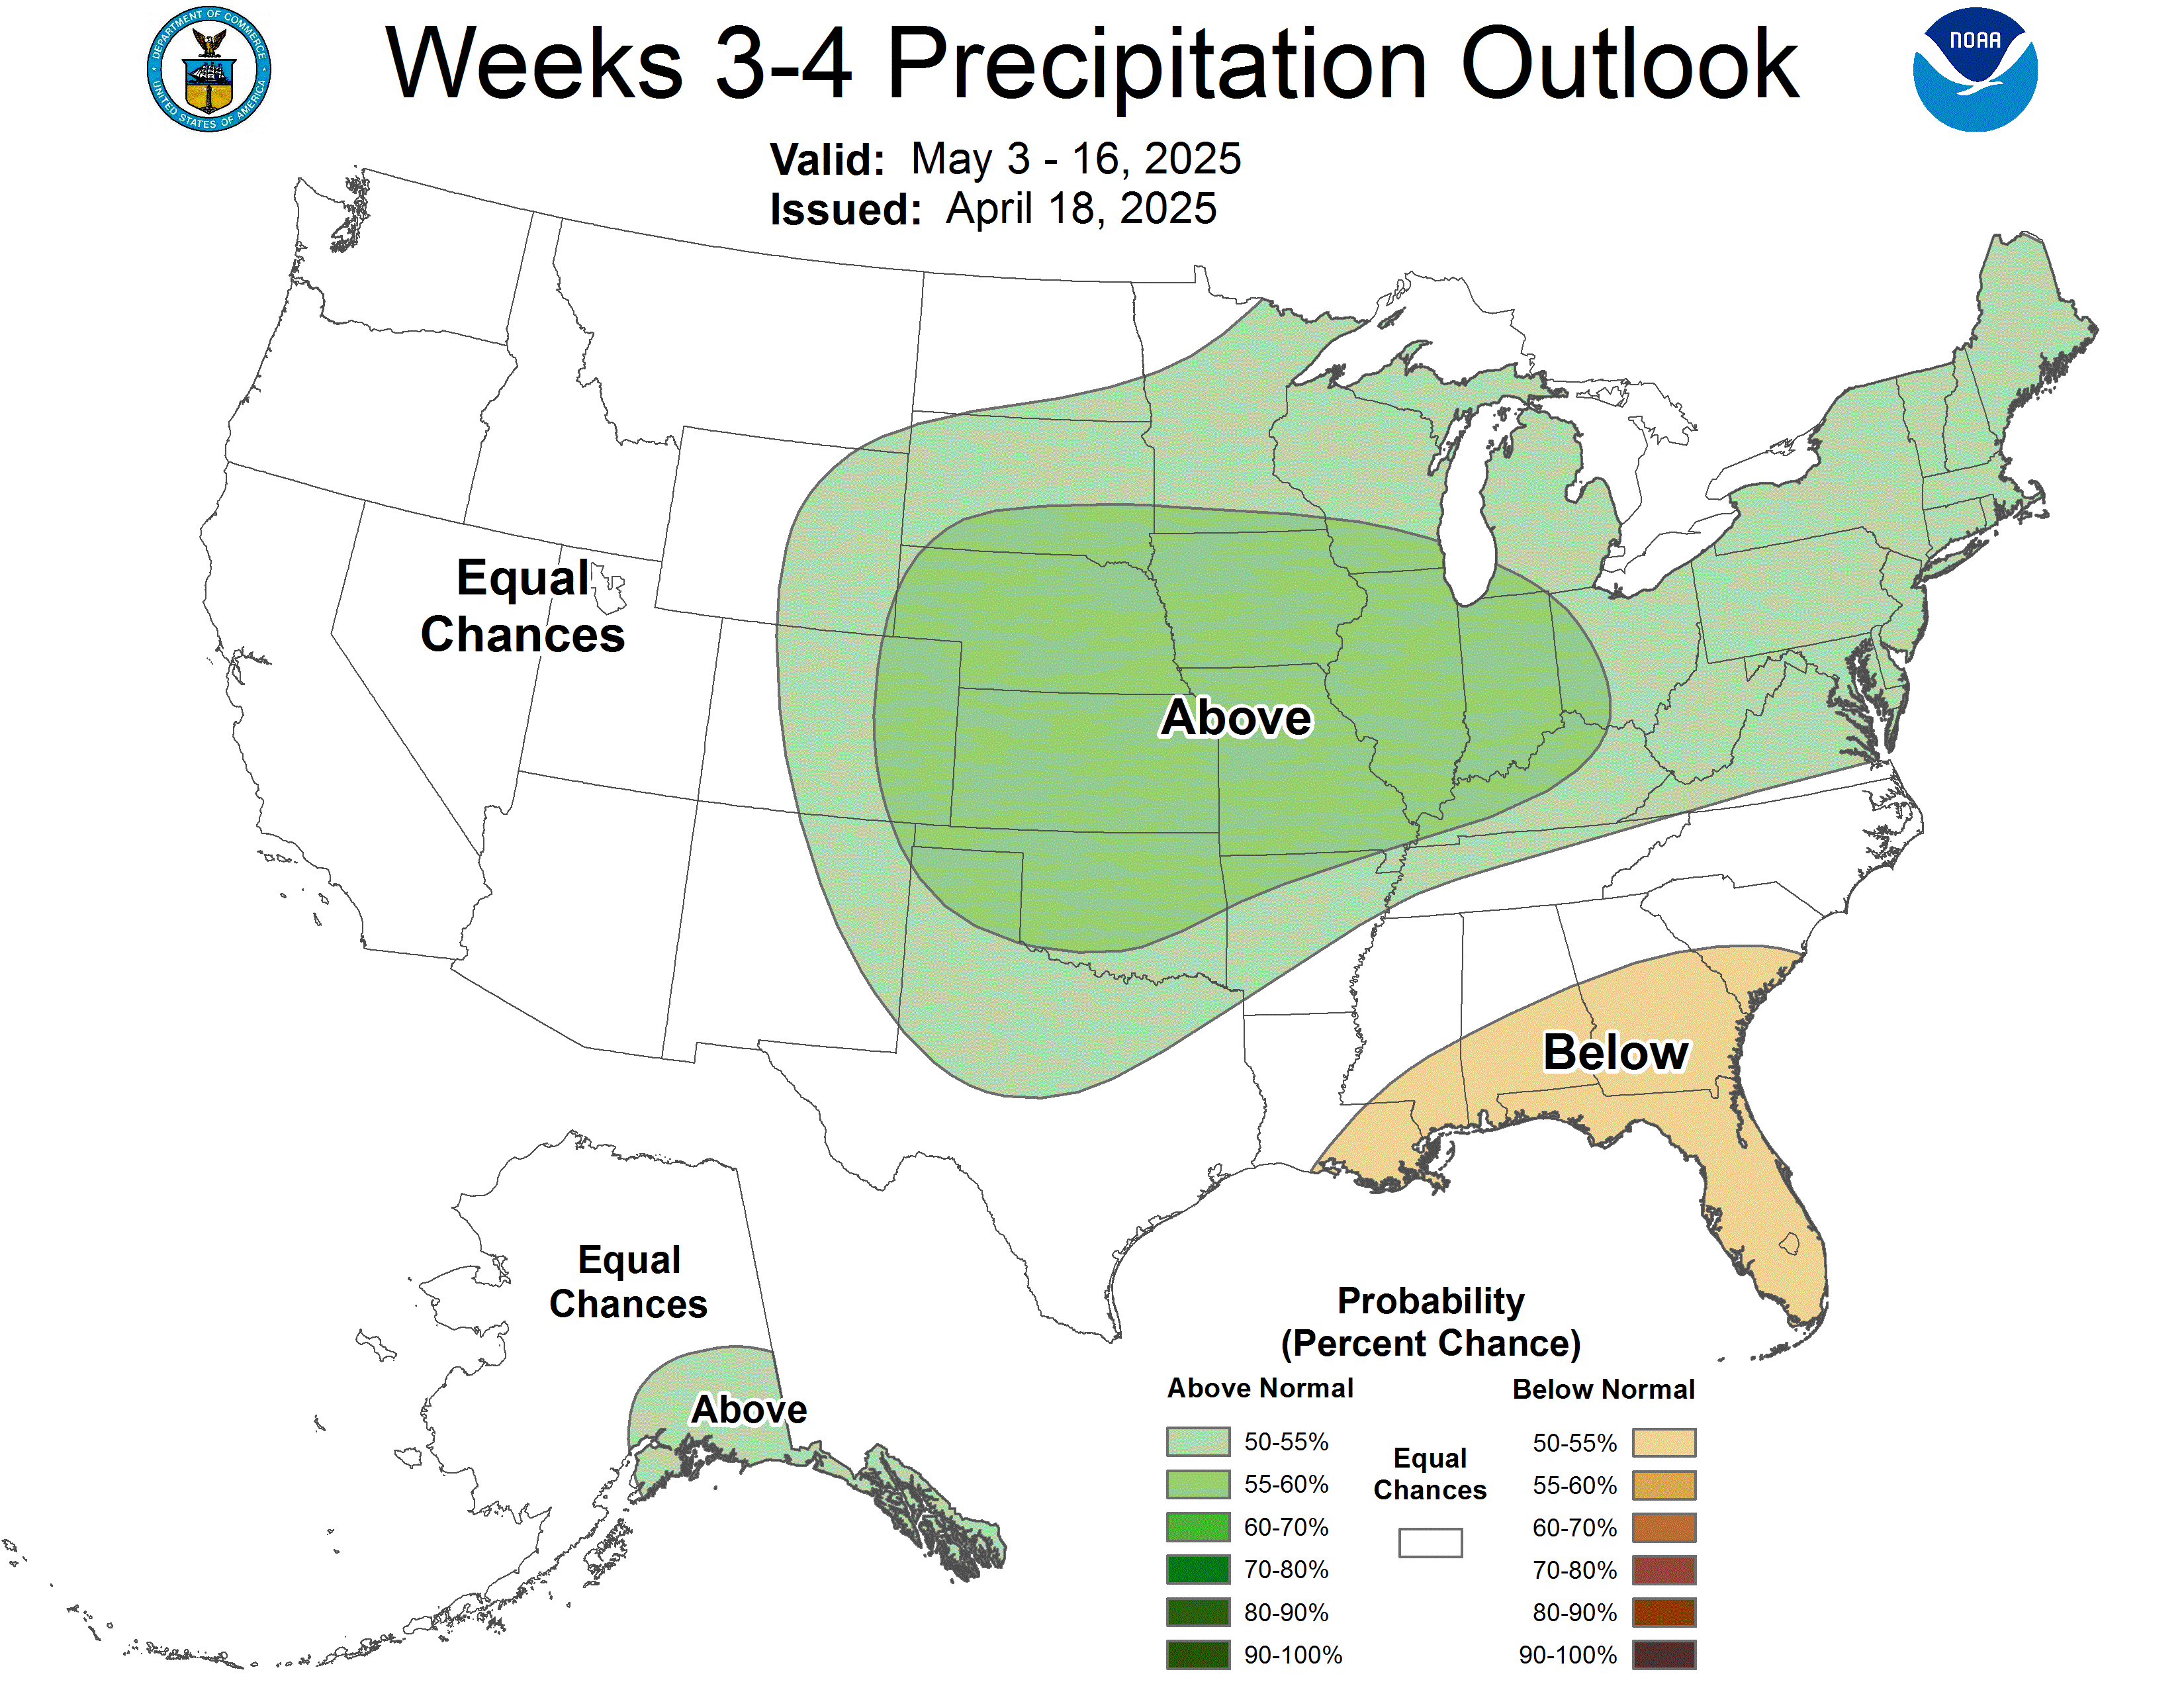
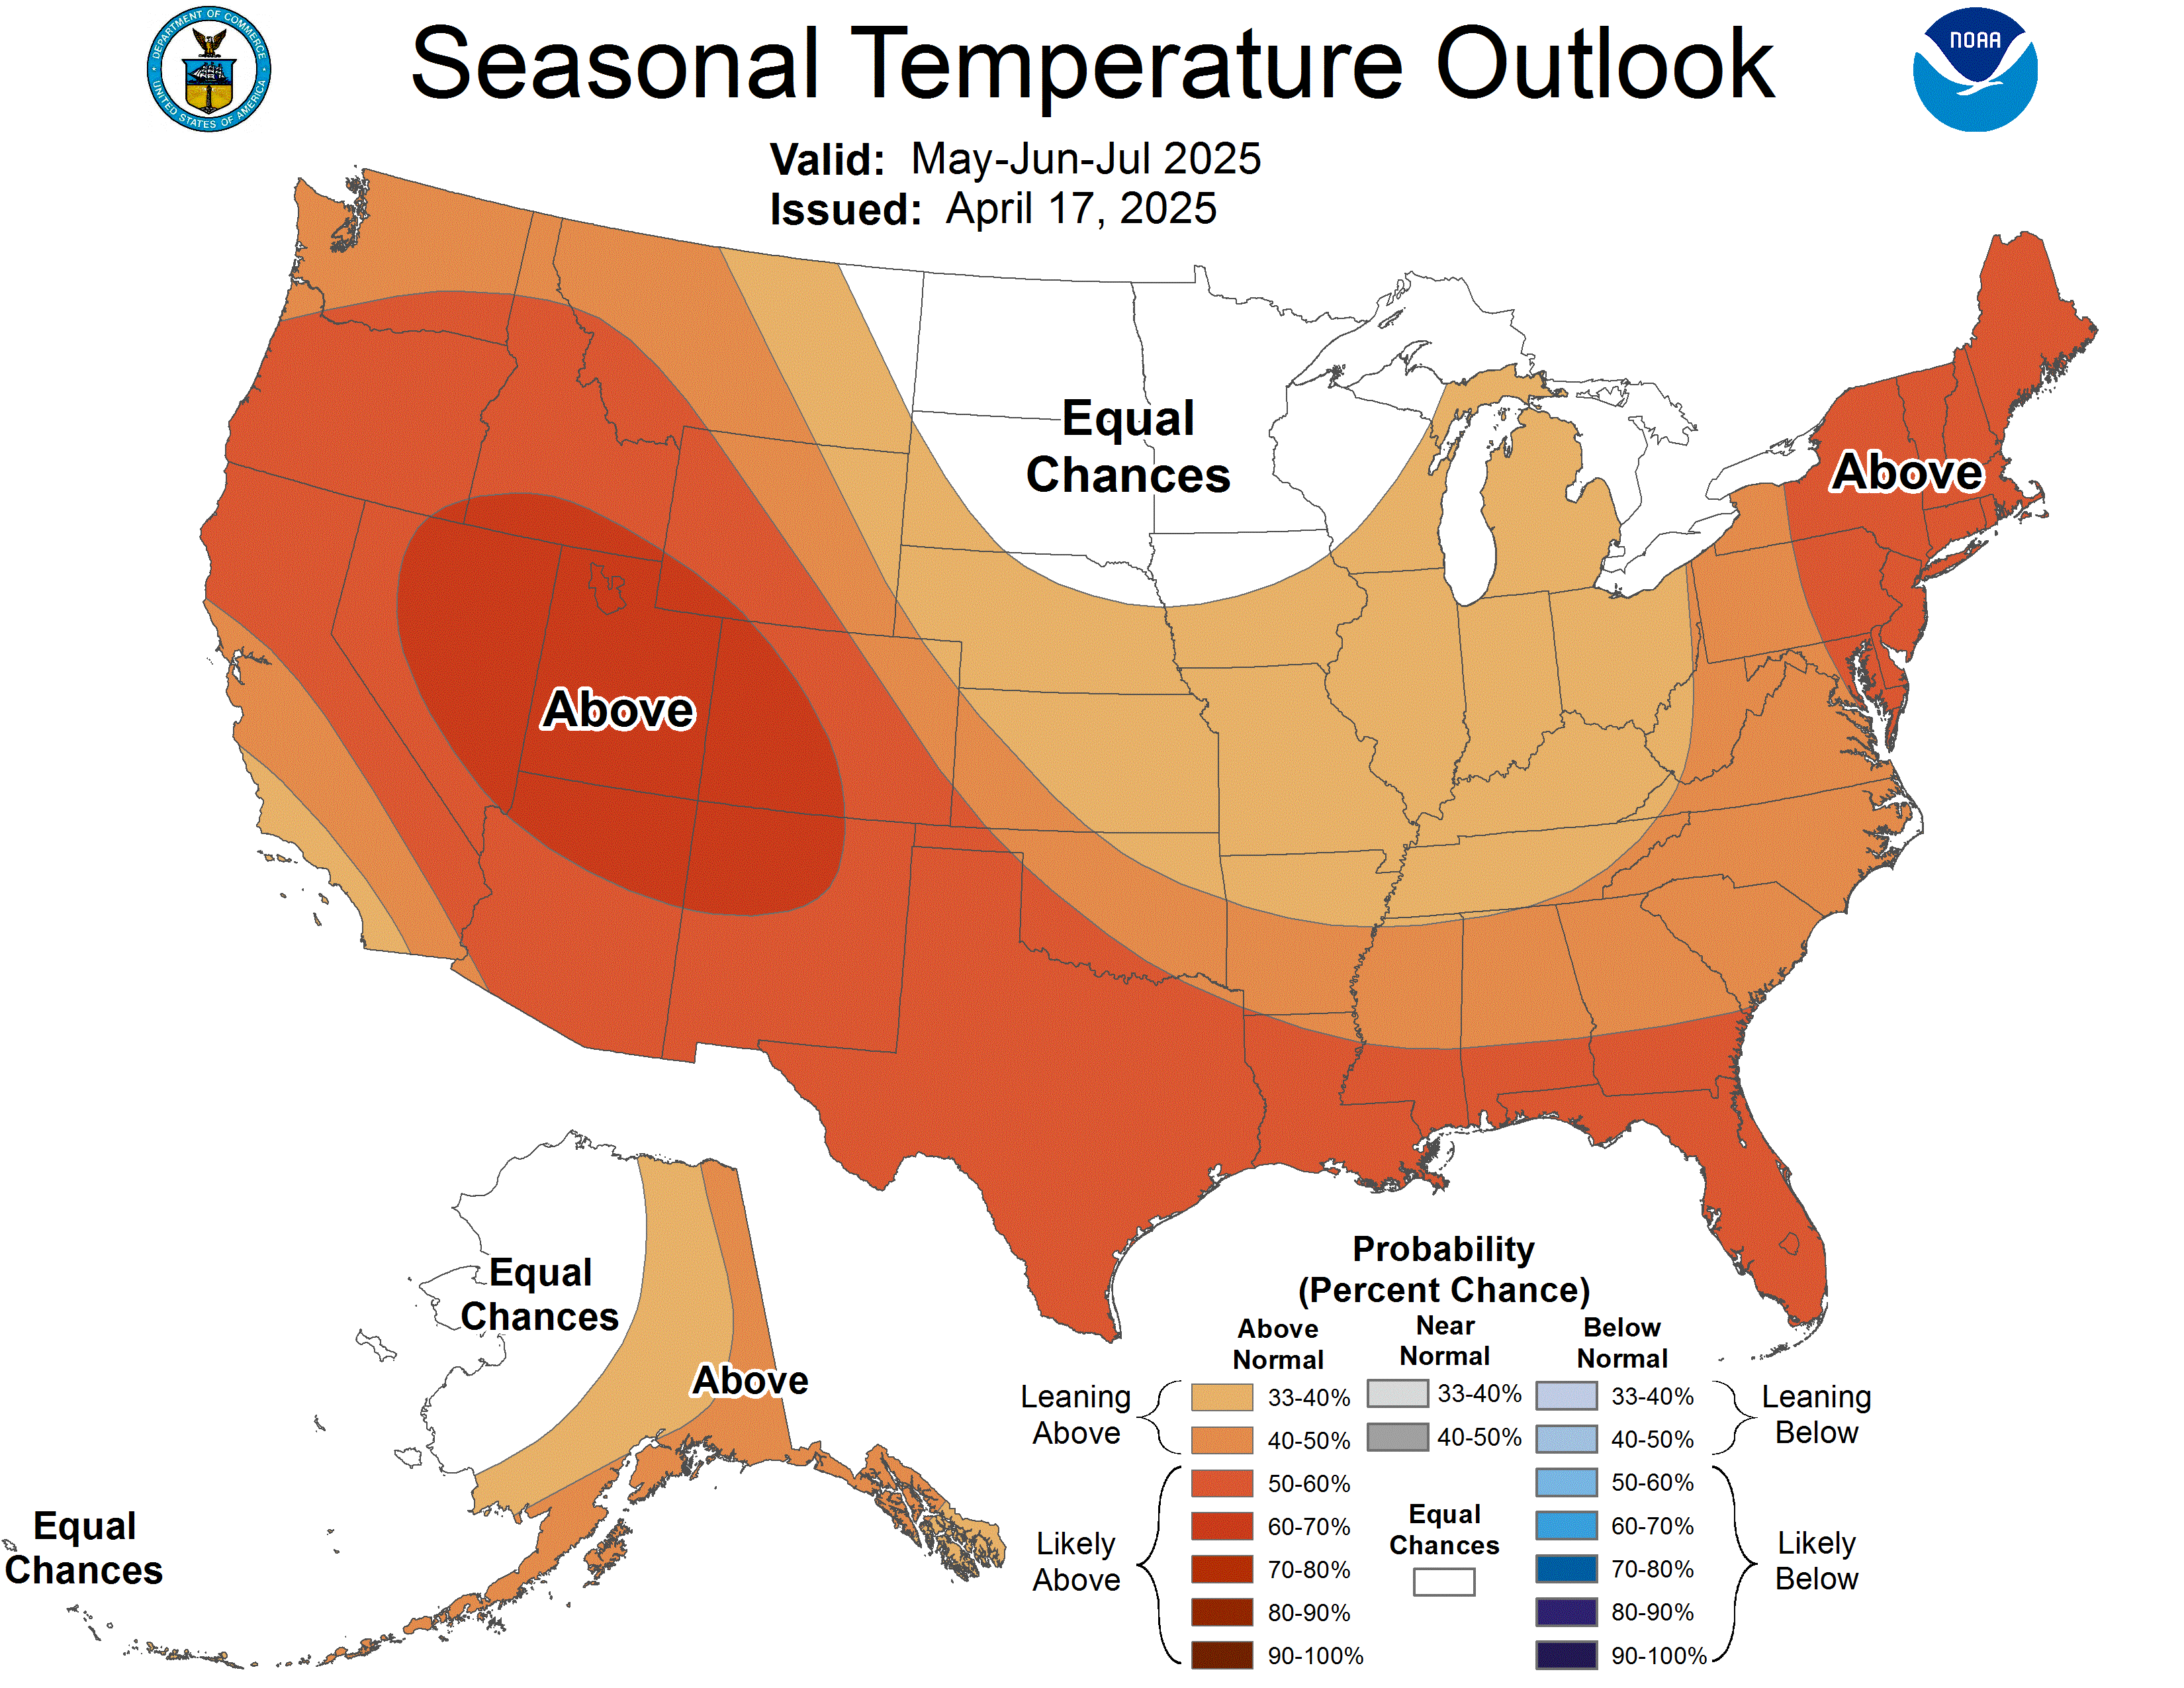
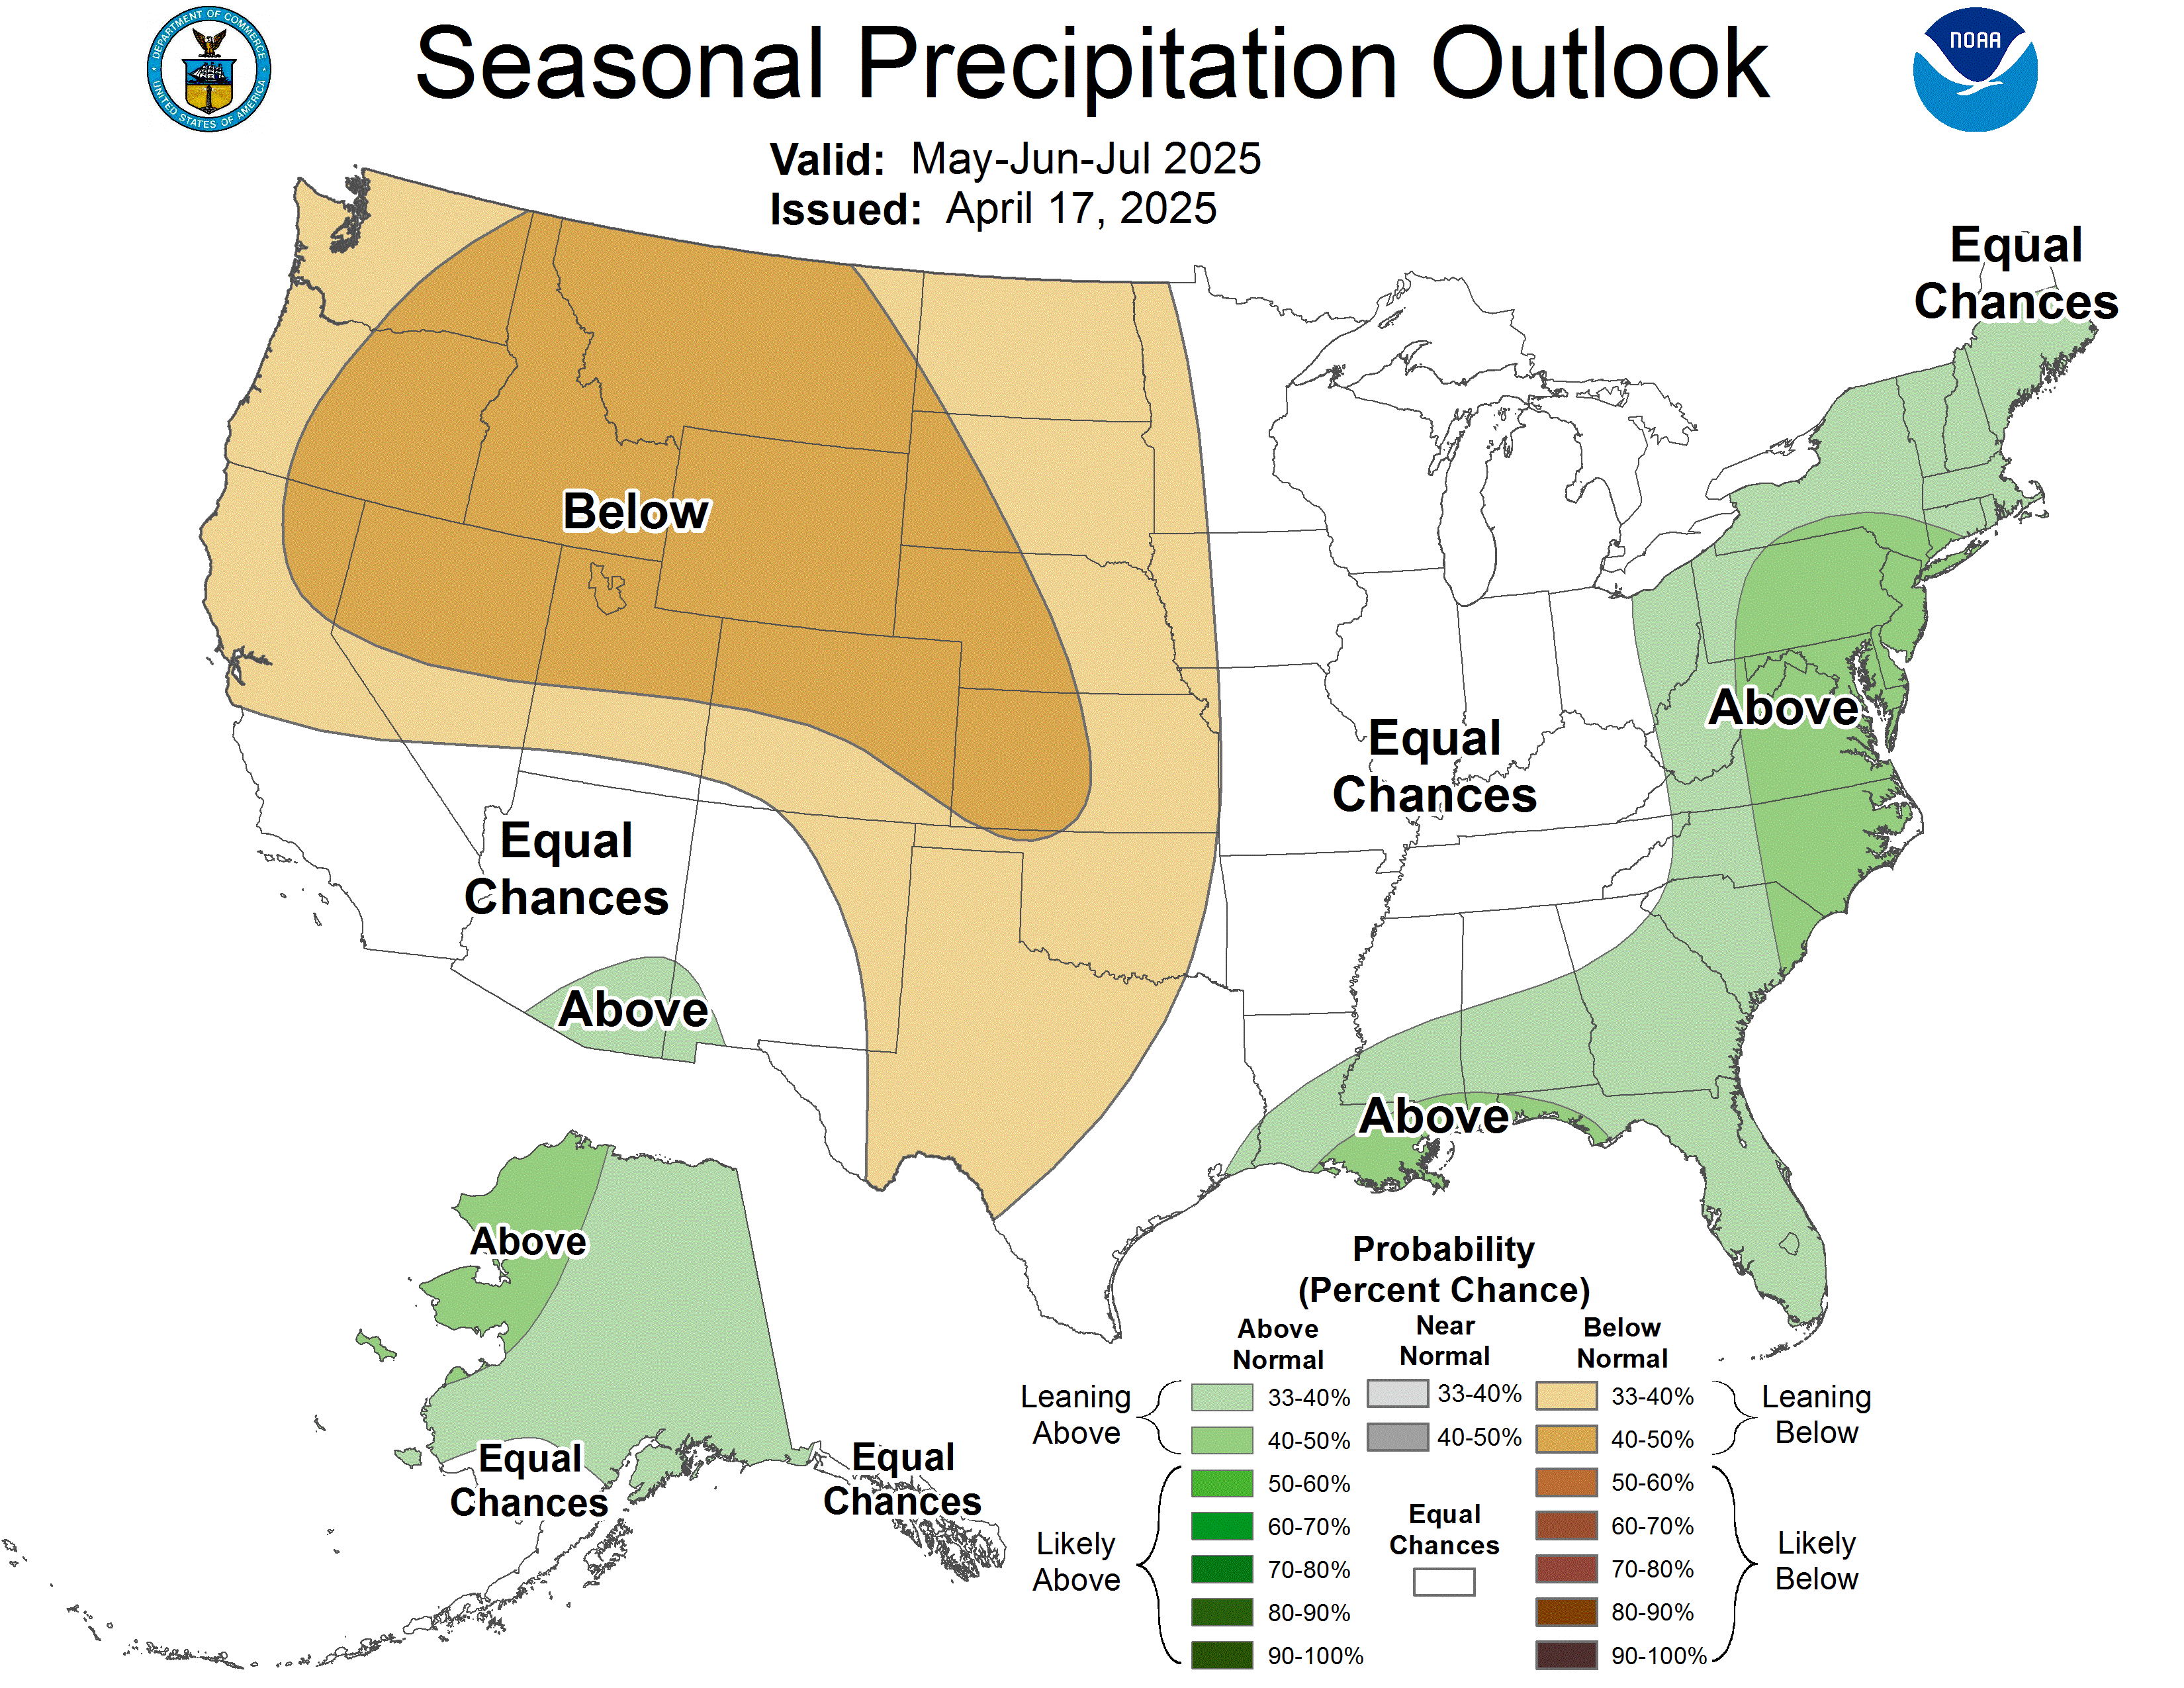
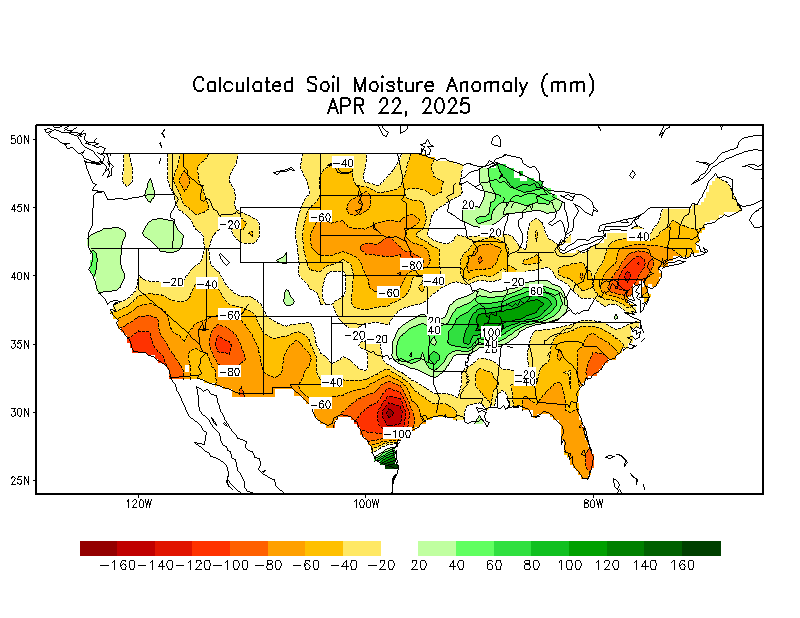
These products are from the NOAA Climate Prediction Center (CPC) and do not necessarily reflect the EPAWA forecast which is detailed above. All images below update automatically as the CPC releases new graphical products
Soil Moisture Anomaly
US Drought Monitor
Forecaster: EPAWA Meteorologist Bobby Martrich
Discussion last updated: Friday November 13th, 2026, 10:45 AM