

EPAWA’s long range outlook is updated weekly every Friday morning before noon
Most recent update: Friday October 2nd, 10:00 AM

Technical discussion for advanced readers:
The technical discussion below will feature two (2) subcategories: Precipitation, and Pattern Discussions. Storm possibilities will be discussed exclusively in the Premium Forum with intense model analysis leading up to any major snow, ice, or rain events, not publicly. To join this discussion and hear the updated thoughts from our team, visit The My Pocket Meteorologist Page by clicking HERE and select the “Premium Weather Forum” option.
Precipitation Discussion
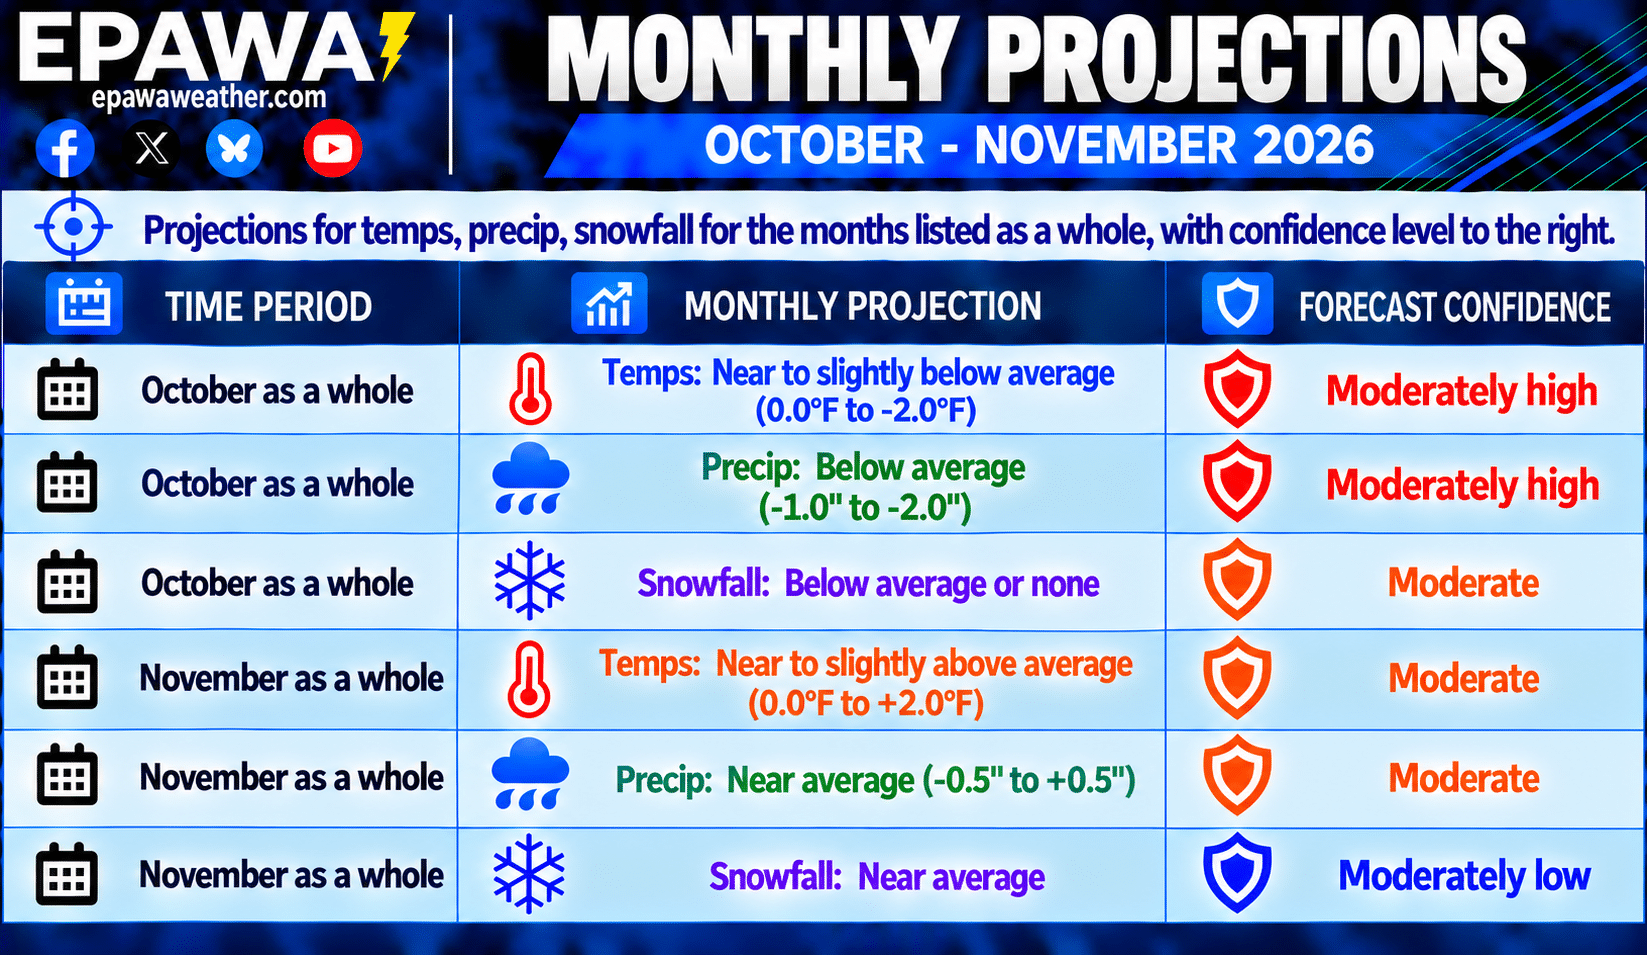
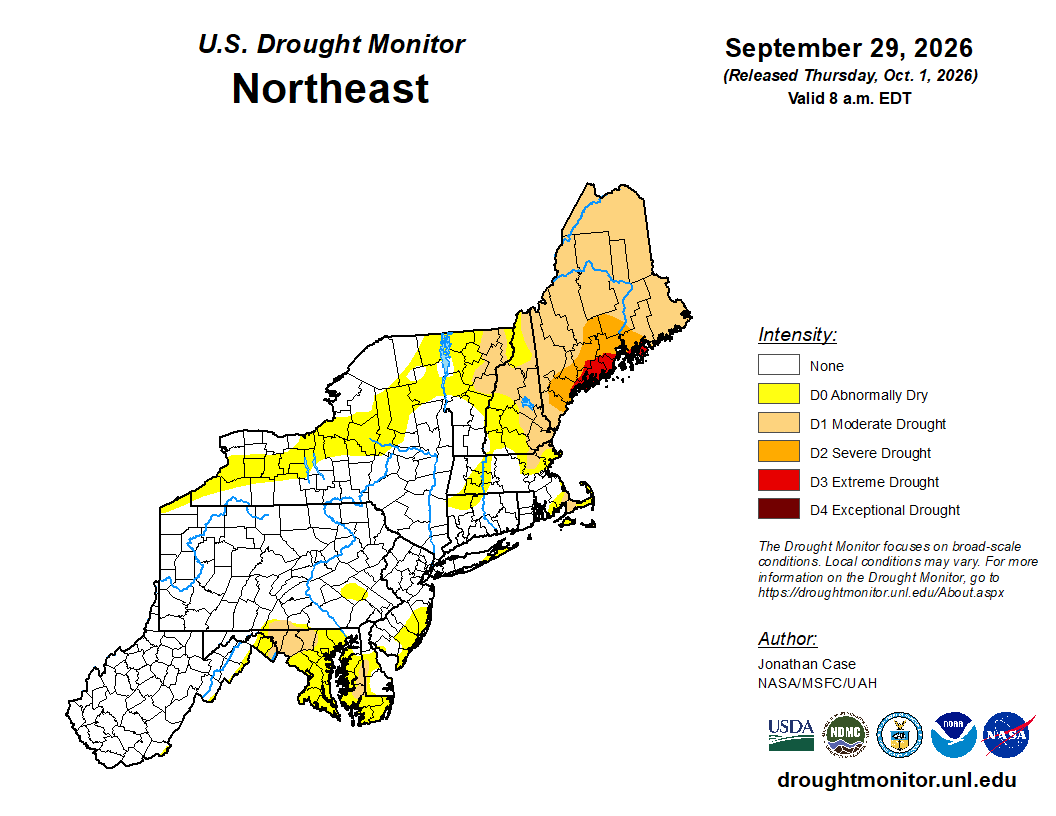
OVERVIEW: There continues to be significant improvement in the precipitation department week to week, and the US drought monitor (photo toward the bottom of this outlook) is reflecting that. Aside from a small area in NW Maryland and Southern Franklin County (PA) as well as a part of the MD Eastern shore where a drought still exits, the remainder of the area is currently without a drought designation. Recent surplus of rainfall through much of August and September greatly impacted the drought situation. However the projection for October was maintained this week for below average (-1.0″ to -2.0″) precipitation for the month as a whole, so whatever progress was made should cease in the coming weeks. Snowfall is expected to be below average or none at all… but October snowfall isn’t common for most of the area. The month of November projections were introduced this week for near average (-0.5″ to +0.5″) precipitation in accordance with longer term climate models and global observation trends.
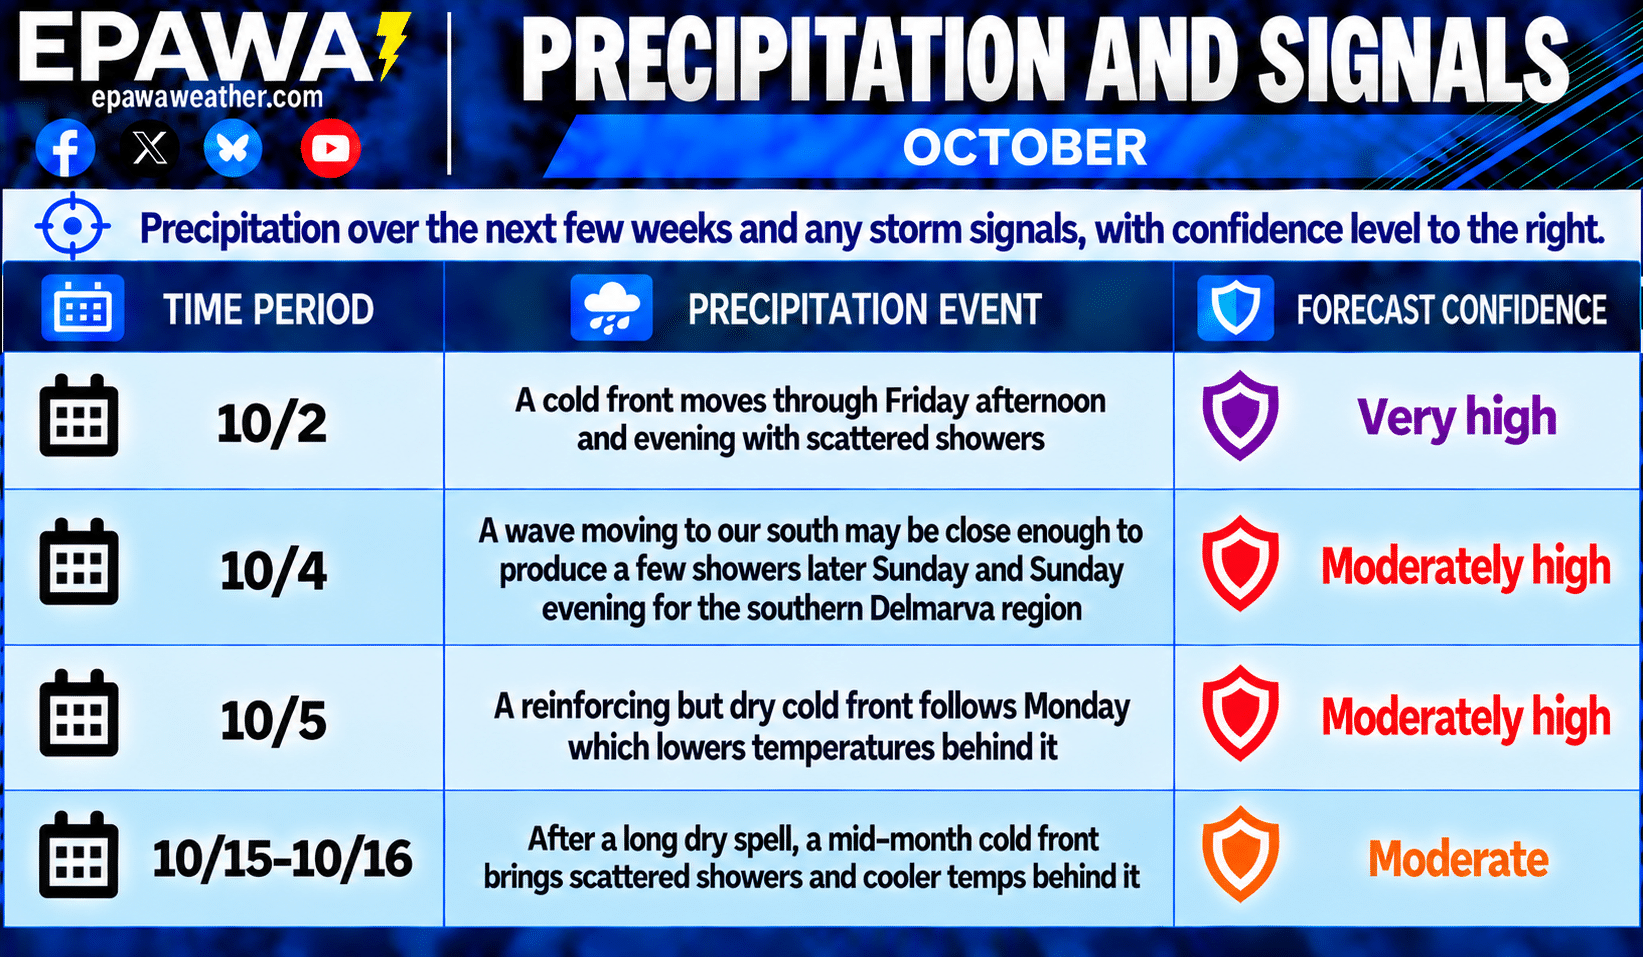
Shorter term, after a rather wet stretch in August and September, a much quieter pattern is expected going forward. A cold front moves through Friday afternoon and evening with limited precipitation, then quickly dries out overnight. A wave moving to our south Sunday afternoon could be close enough to bring scattered showers to mainly SE areas of the Delmarva, then a dry reinforcing front moves through Monday. Next rain chance is mid-month with a cold front.
Breakdown of precipitation departures from normal over the next several weeks:
October 4th – October 10th: Below average
October 11th – October 17th: Slightly below average
October 18th – October 24th: Slightly below average
October 25th – October 31st: Near to slightly below average
November 1st – November 7th: Near average
November 8th – November 14th: Near to slightly above average
Public/free available maps will be updated when a threat is imminent for significant weather on the weather alerts page throughout the year: http://epawaweather.com/weather-alerts/
Note: Any image below is clickable for larger viewing
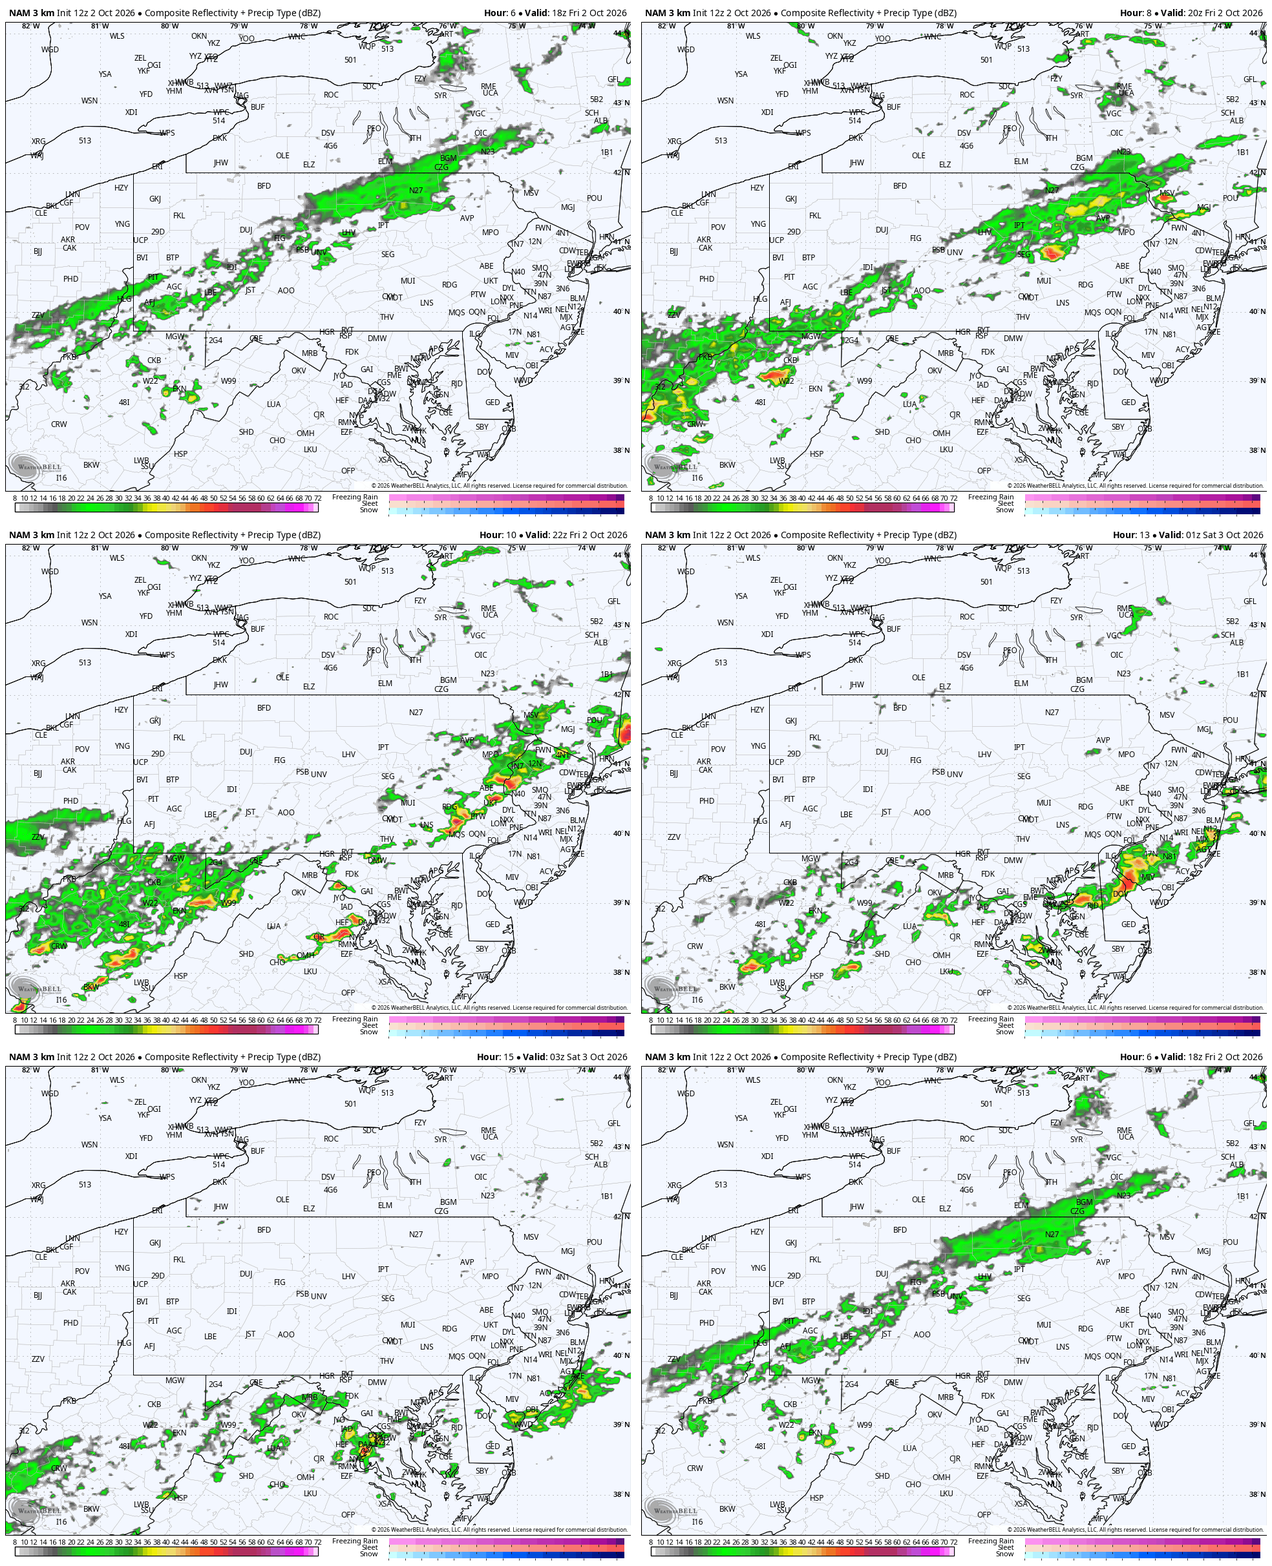
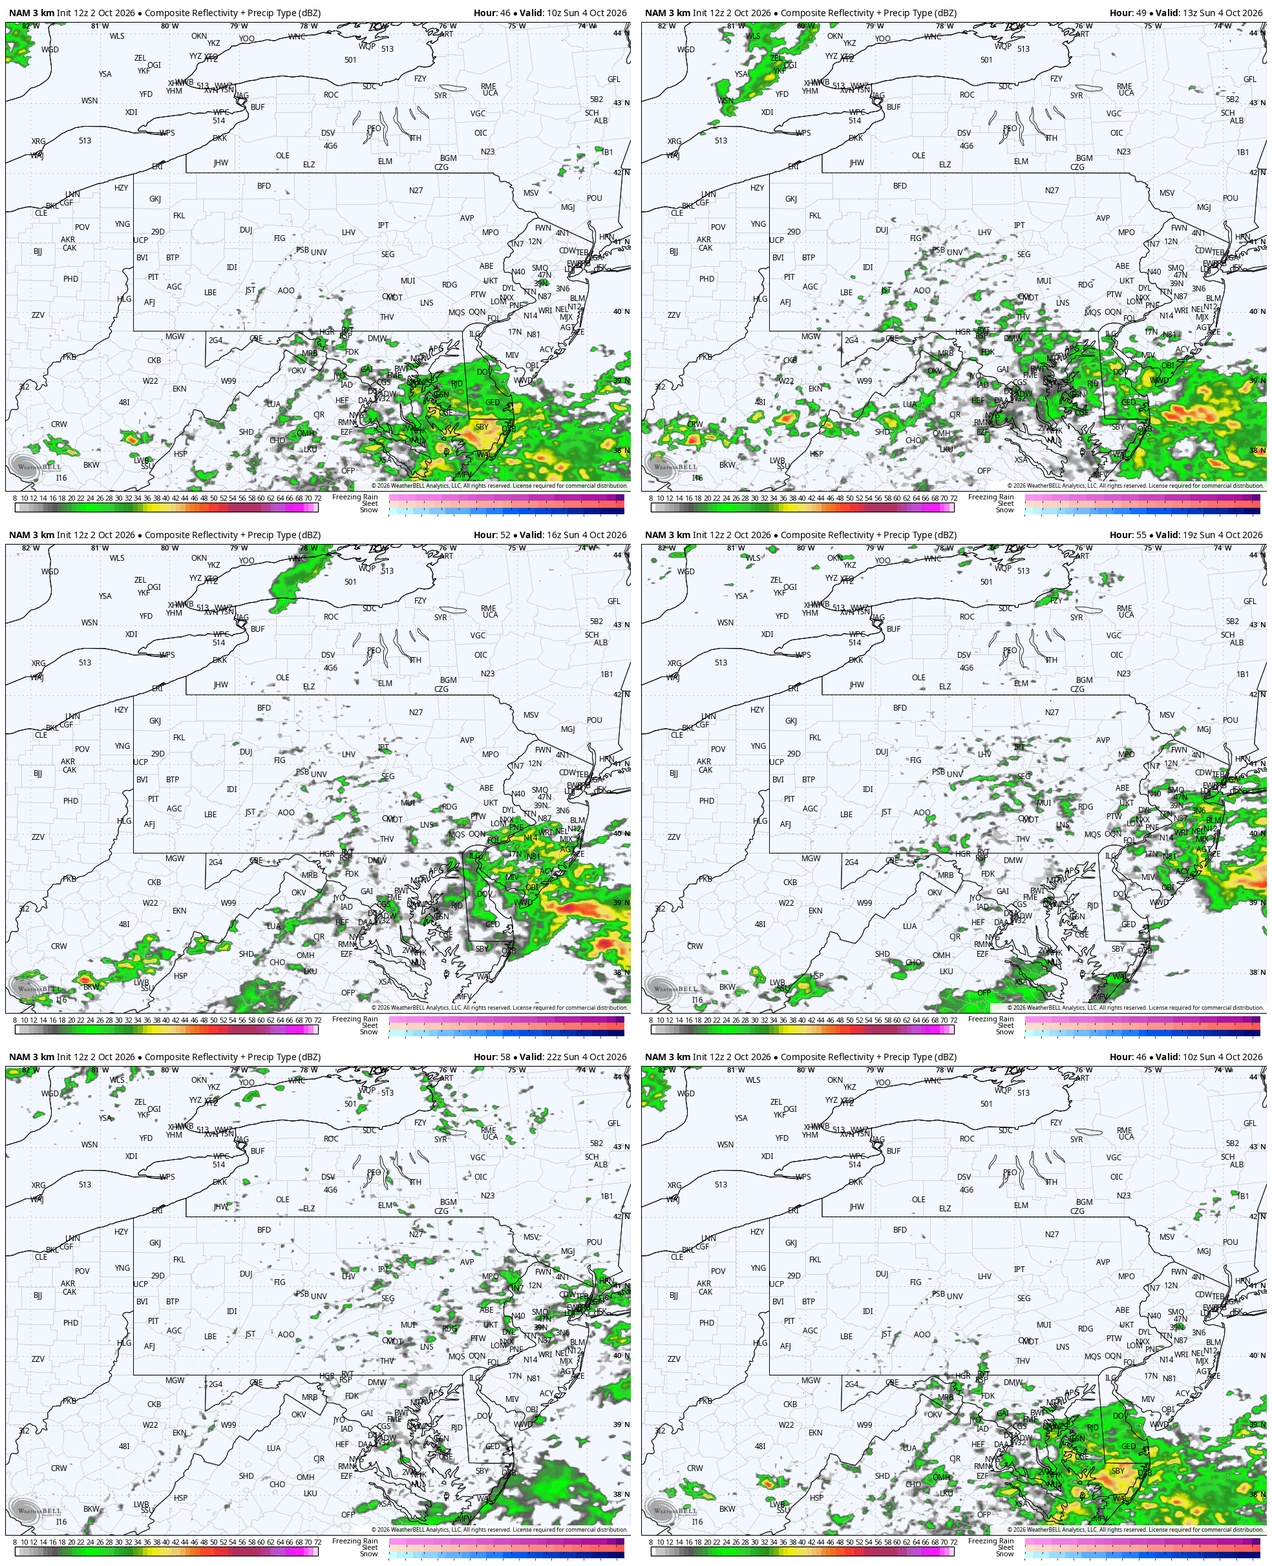
A system passing to our south Sunday afternoon could be close enough to bring scattered showers to mainly our southeastern areas as it moves along a stalled frontal boundary.
Pattern Discussion
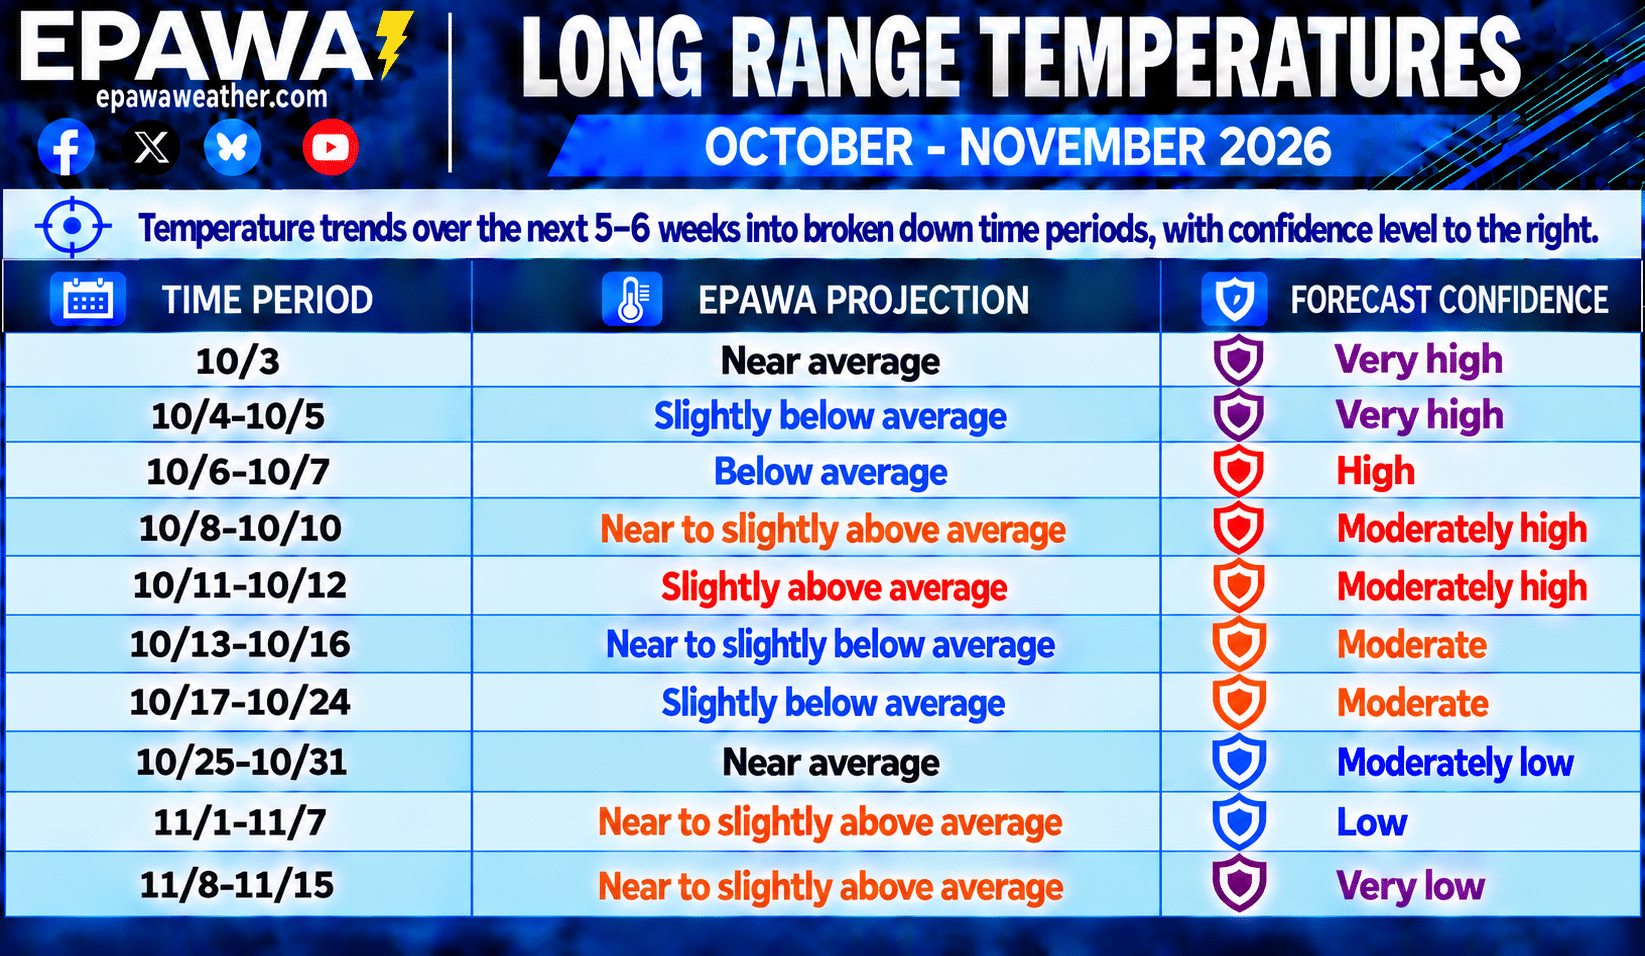
OVERVIEW: Our projection for October was maintained this week for a near to slightly below average (0.0°F to -2.0°F) temperature departure for the month as a whole, with the expectation of several cooler than average stretches this month despite the warm start. November projections were introduced this week for a near to slightly above average (0.0°F to +2.0°F) temperature departure, using long term climate guidance and global observation trends.
- Seasonal changes are going to be become more noticeable in the weeks ahead as we continue to lower average highs/lows, and that downward process accelerates from this point forward to about a 3.0°F drop per week. The extreme heat is likely behind us, but we are beginning October on a much warmer than average note, albeit temporary. Climate models have continued to suggest an up-and-down temperature pattern in October, but more frequent occurrences of at least slightly below average temperatures. This allows the month as a whole to lean very slightly below average. The current expectation for November is, for at least the first half of the month, temperatures lean slightly milder.
- The Madden-Julian Oscillation (MJO) is currently in a very weak phase 8 signal, and is expected to quickly collapse into the Circle of Death (COD) or NULL phase over the weekend. Once we near mid-October, both the GEFS extended and EPS weeklies are suggesting a phase 2 propagation, which generally signals milder conditions a few weeks later – supporting the milder start to November current outlook. Hurricane activity should remain limited at best with a strong El Niño increasing Atlantic shear despite reaching the peak of Atlantic hurricane season September 10th. In fact, this is the longest we’ve gone without an Atlantic Basin hurricane since 1966 in the modern satellite era, which is pretty remarkable. It is also the longest stretch in the pre-satellite era since 1914… a season where no hurricanes were present, or at least none that were documented.
- A composite average of the Sea Surface Temperature Anomalies (SSTa) in the ENSO regions places it in strong El Niño territory currently. The following are Coral Reef Watch Sea Surface Temperature Anomaly values referenced in this context. From west to east across the Pacific, the Niño 4 (west-central Pacific) is currently the “coolest” region at +1.2°C, whereas the Niño 3.4 region (east-central Pacific) is currently at +3.3°C. The eastern regions of Niño 3 (east-central Pacific) is currently +4.1°C, and Niño 1+2 region (near the Peruvian coast) is at an astounding +5.3°C as of September 30th. A near-record strong El Niño Fall is likely to continue, and is currently East-based.
Average high temperatures are currently in the 69-74°F range from north to south across our coverage region, which is about 3°F lower than at this point last week. The drop off in temperatures are now accelerating downward throughout Fall at about a 3°F per week drop. Any above or below average stretches listed in the outlook will be relative to seasonal norms at that time, and it is important to note that cooler/warmer periods will be relative to the time of year we are talking about. For example, the below average temperatures listed for the October 6th-7th period features highs in the 60-65°F range, coming at a time when average highs are in the upper 60s to lower 70s. Use the average highs/lows chart below providing transparency for what average temperatures are at each corresponding location through November 15th.
Note: Any image below is clickable for larger viewing
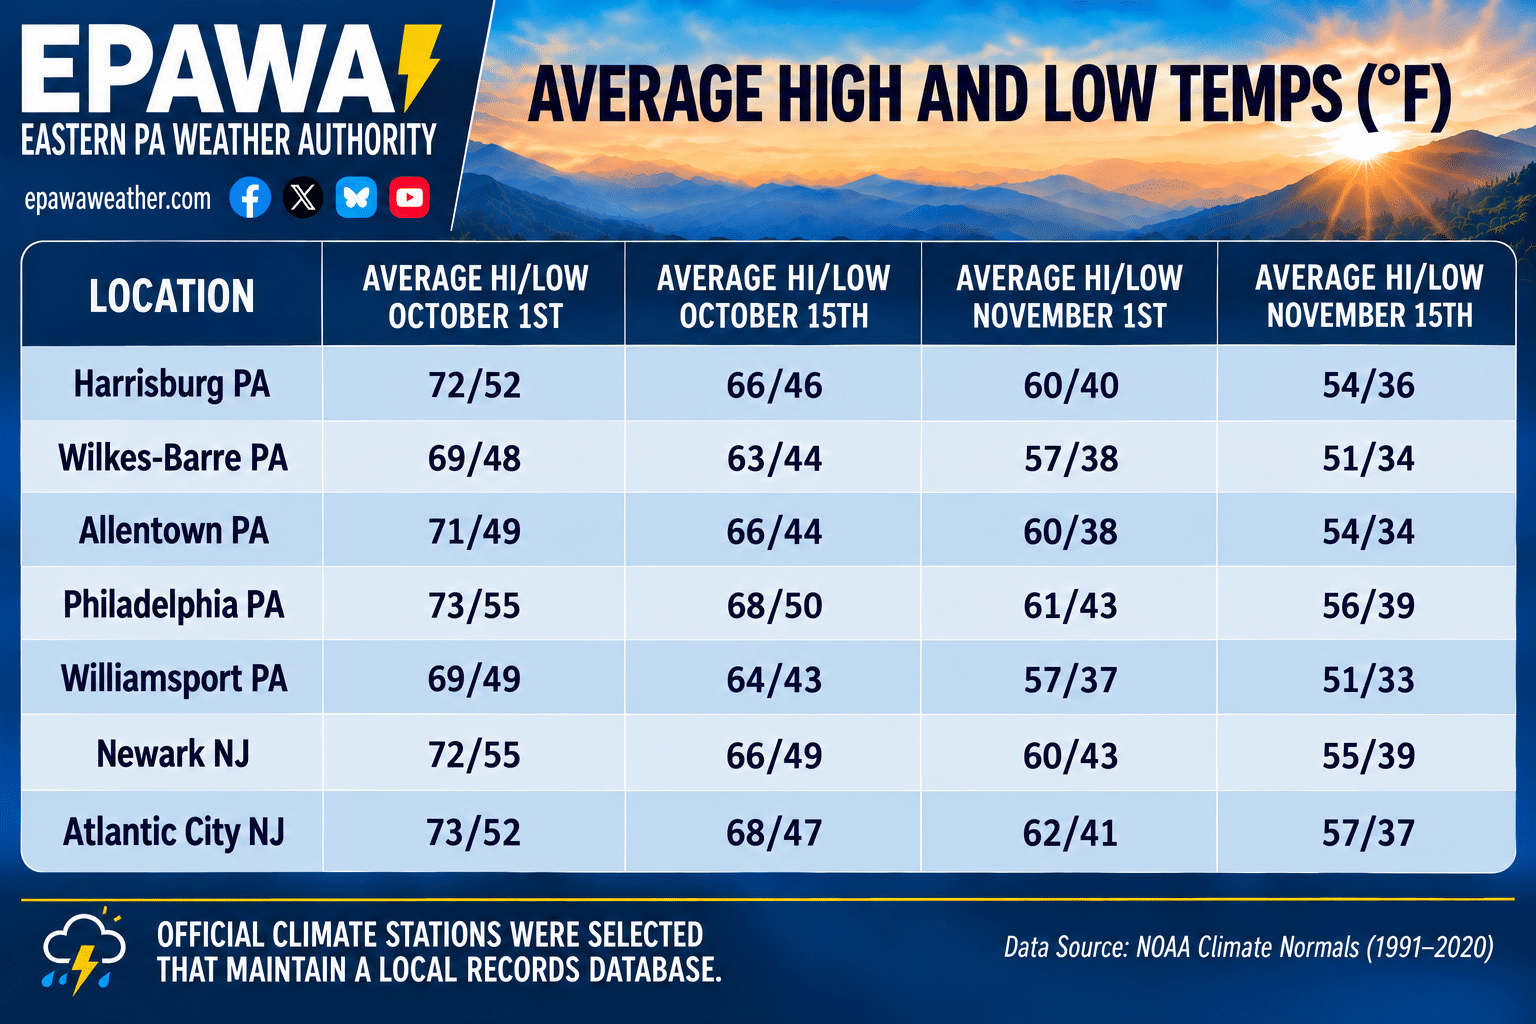
Average temperatures at our major climates stations across the region are shown over the next 6 weeks; average temps will drop at a much faster rate of ~3°F per week through Fall.
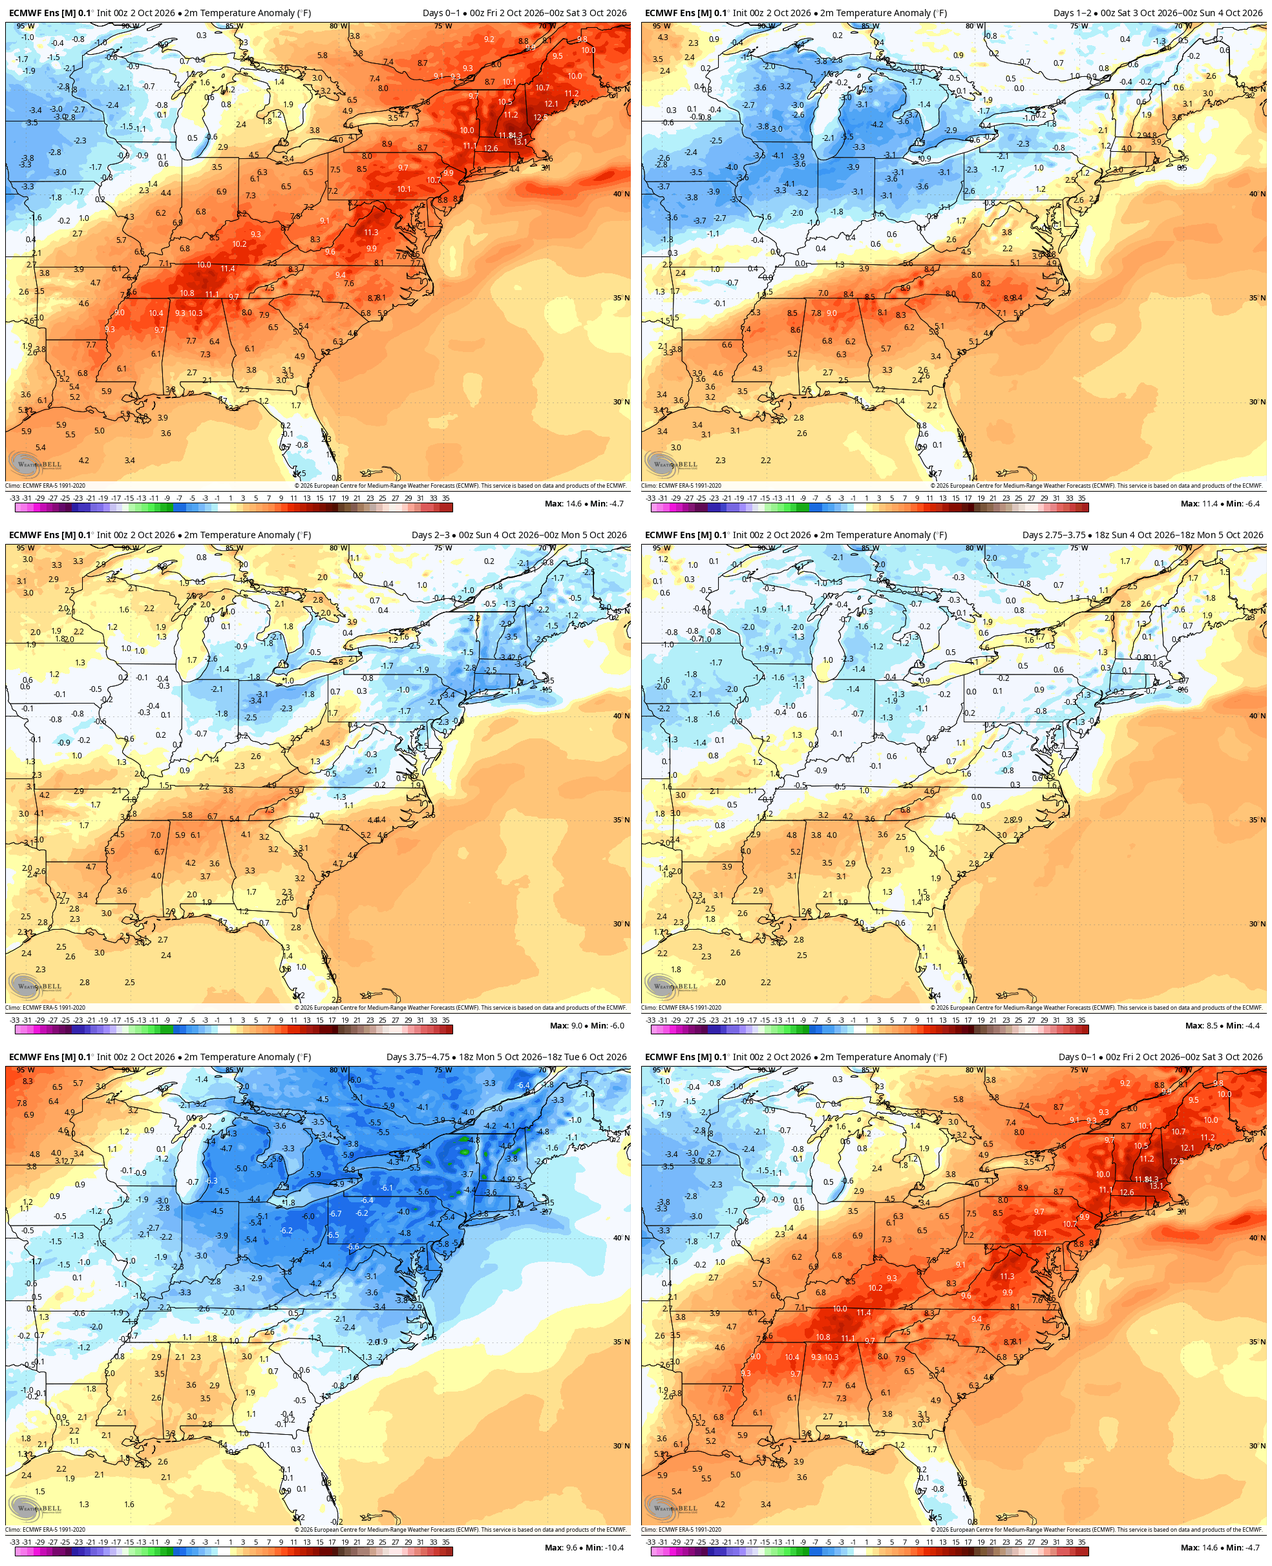
EPAWA's Long Range Projections
Projections last updated: October 2nd; next scheduled update: October 9th
Climate Prediction Center Products
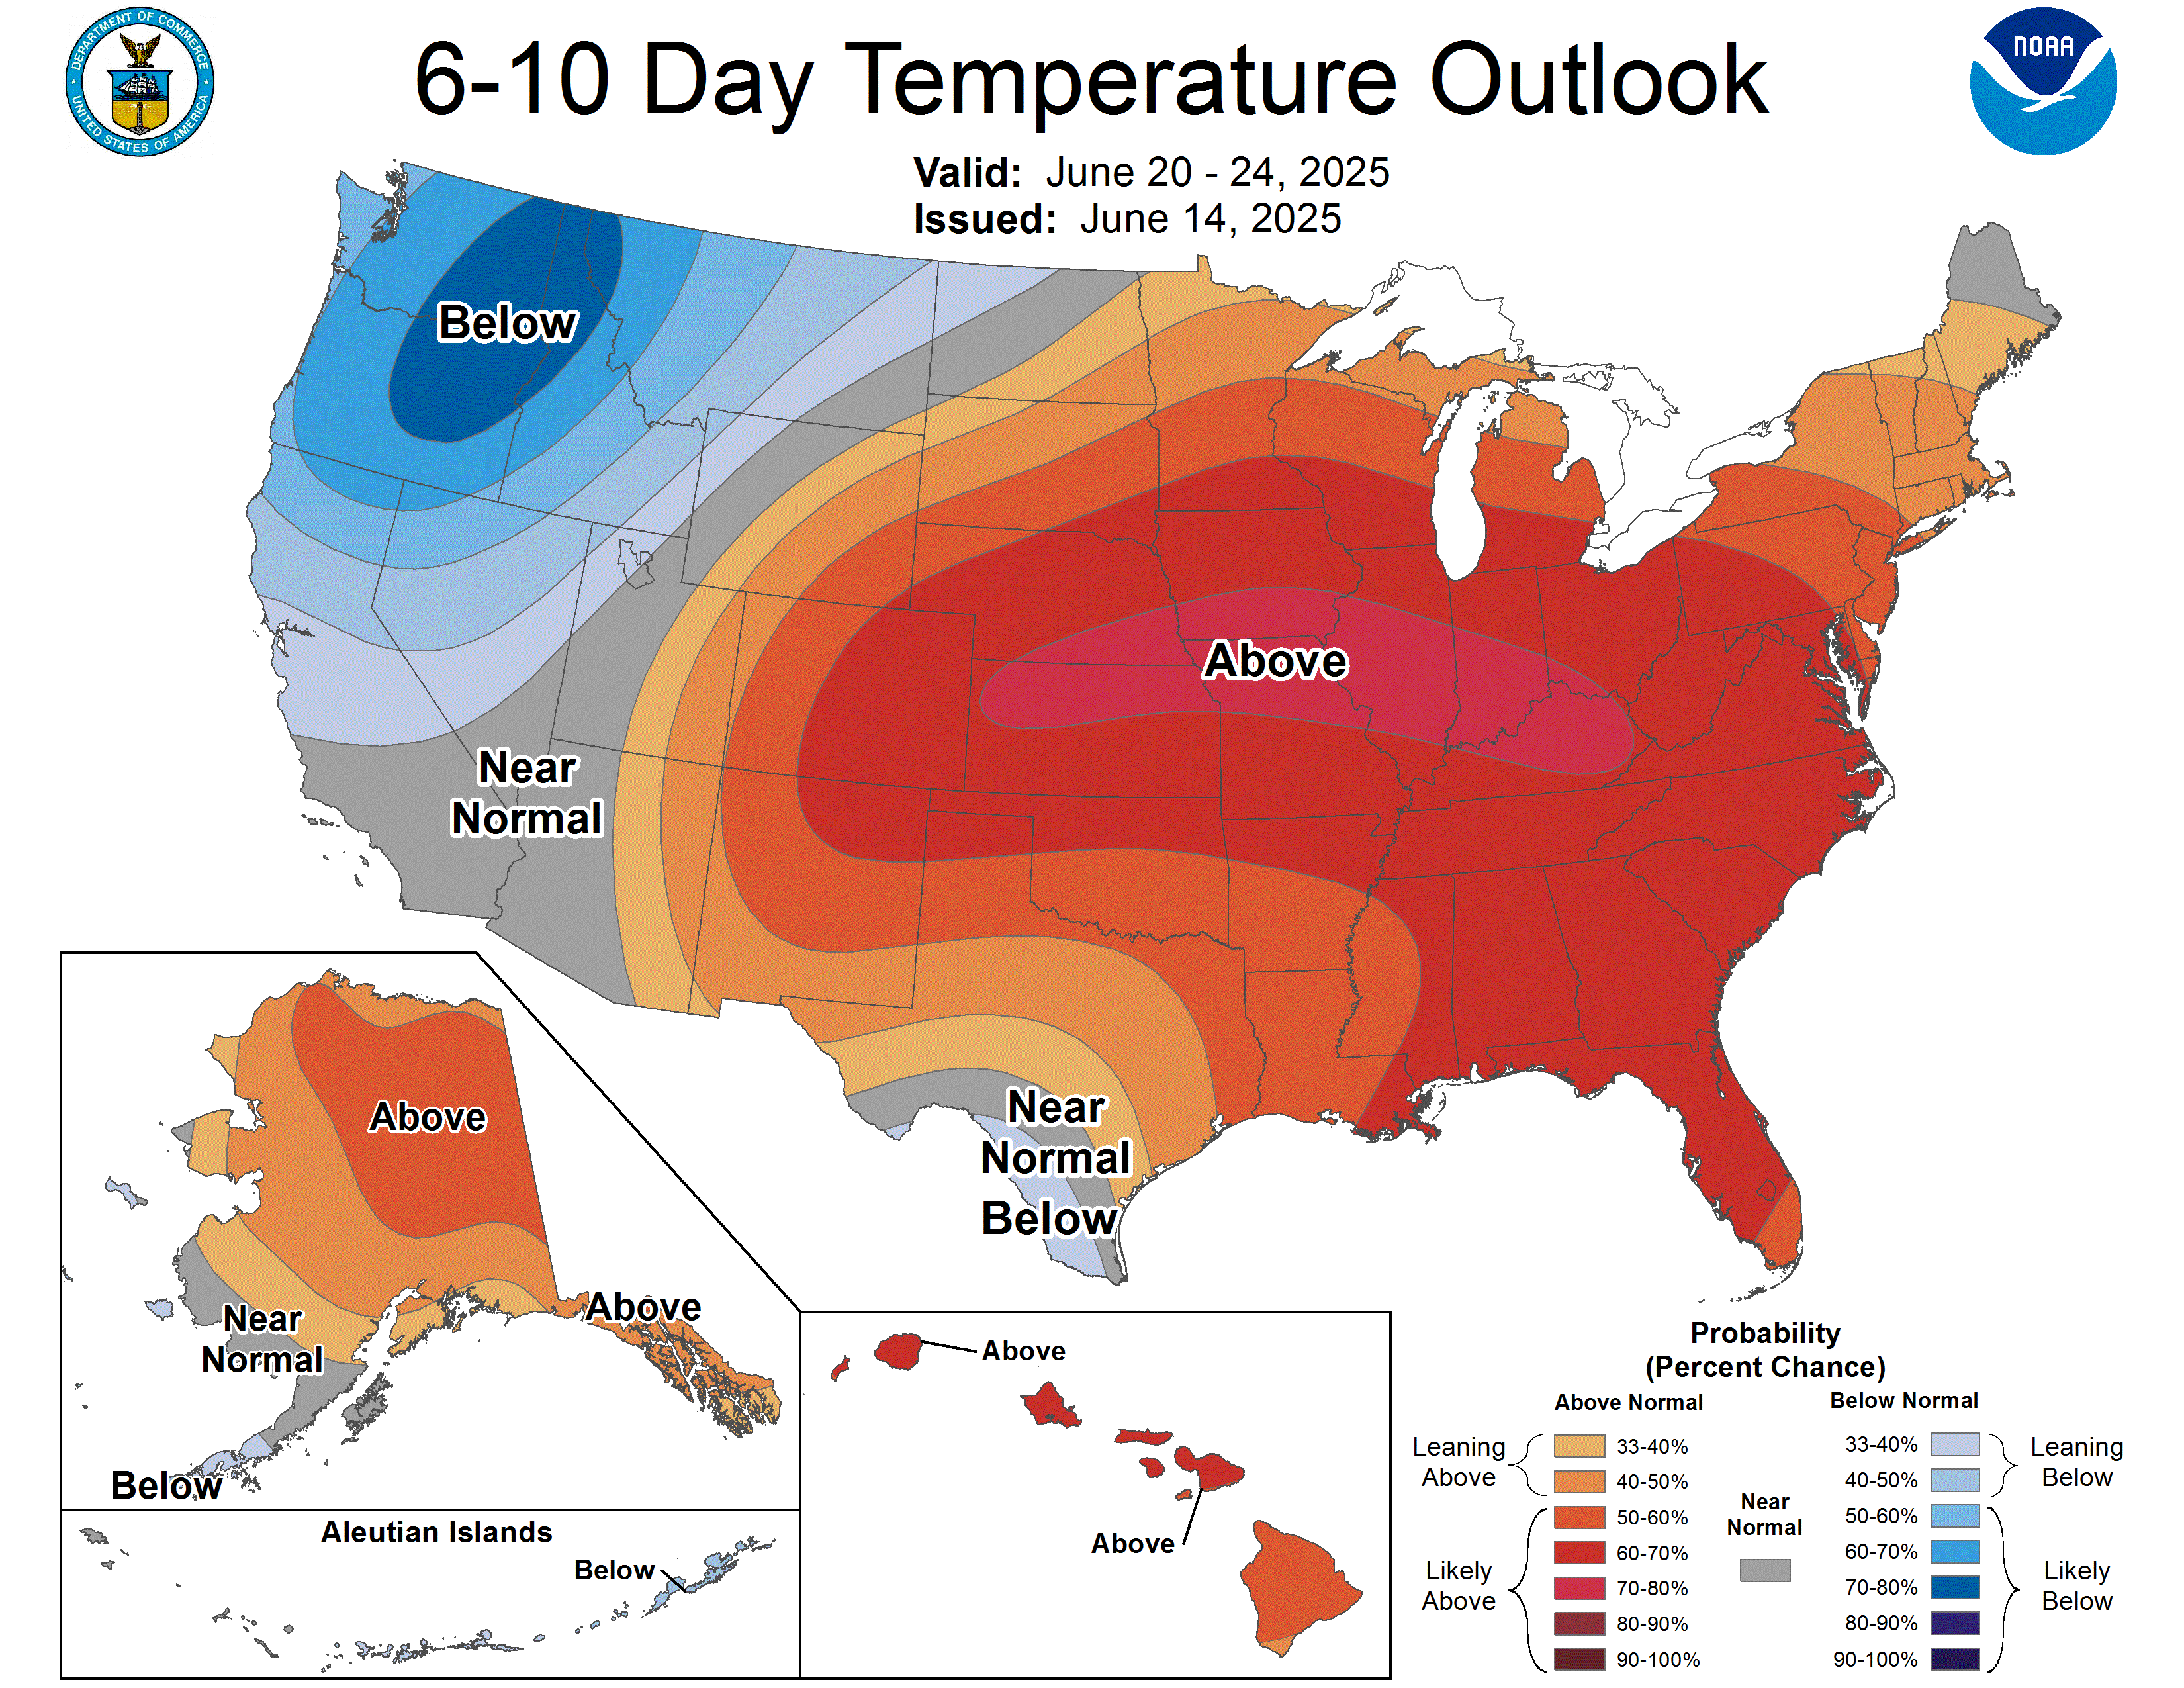
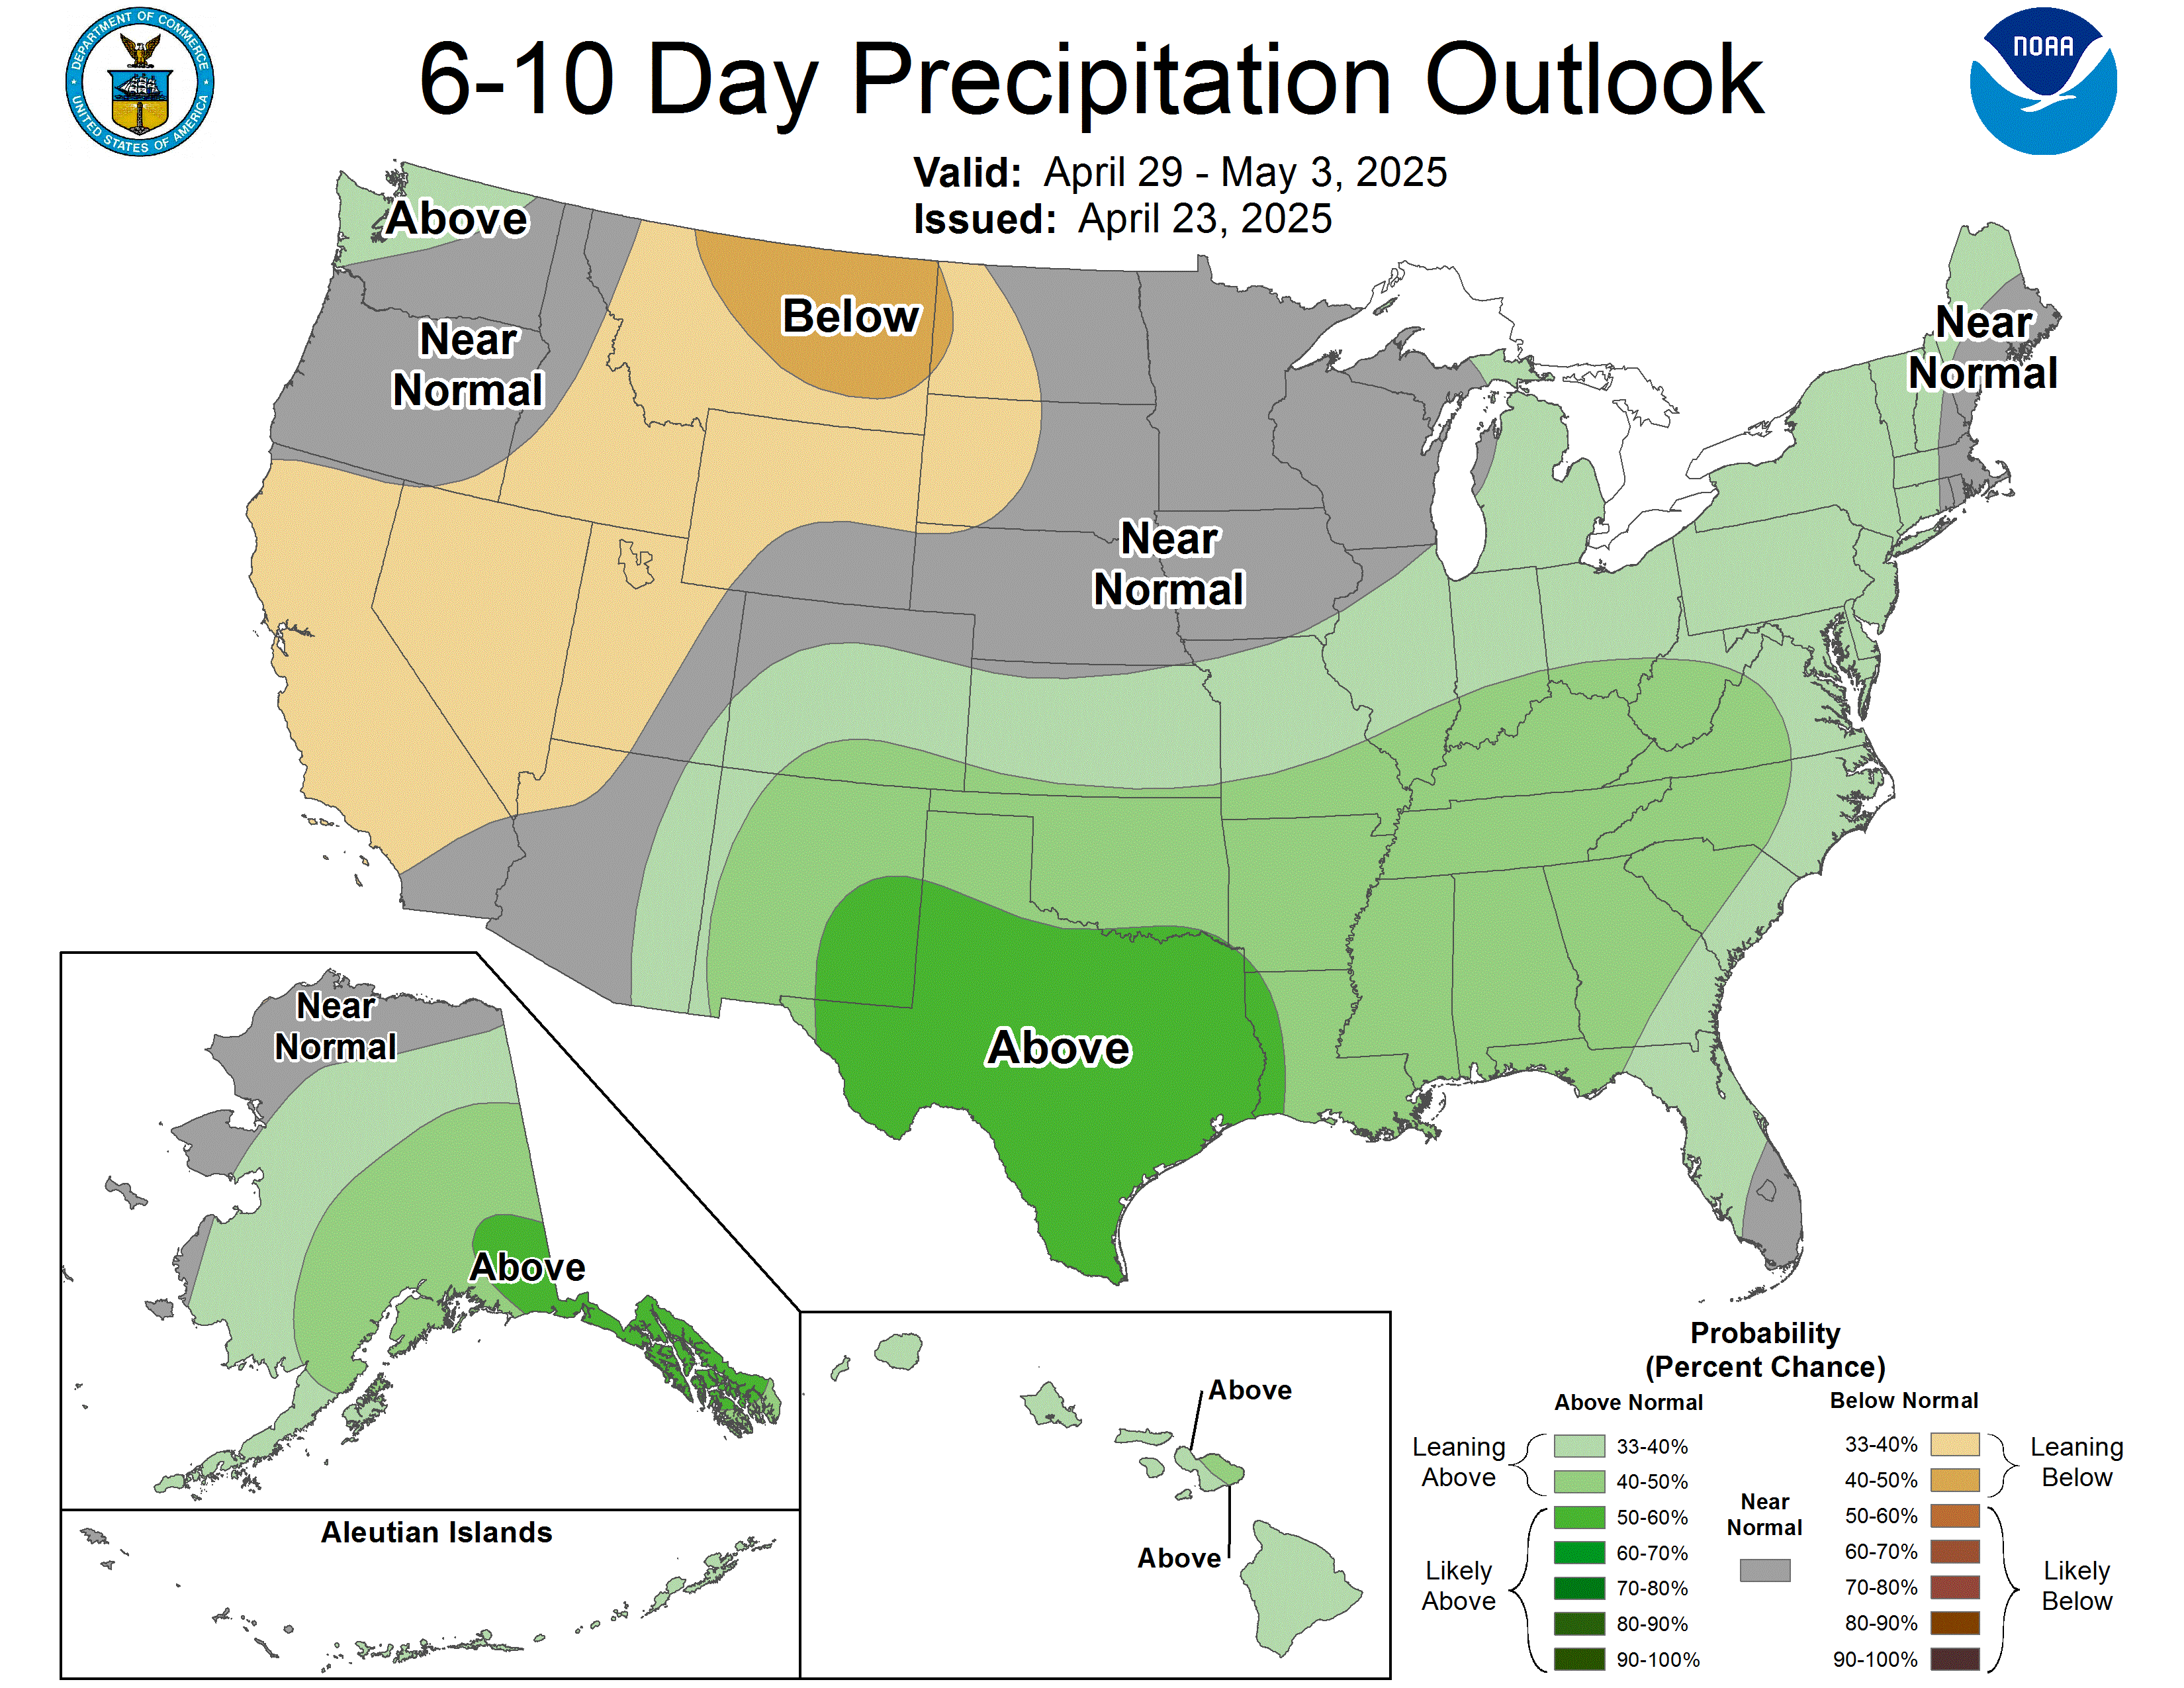
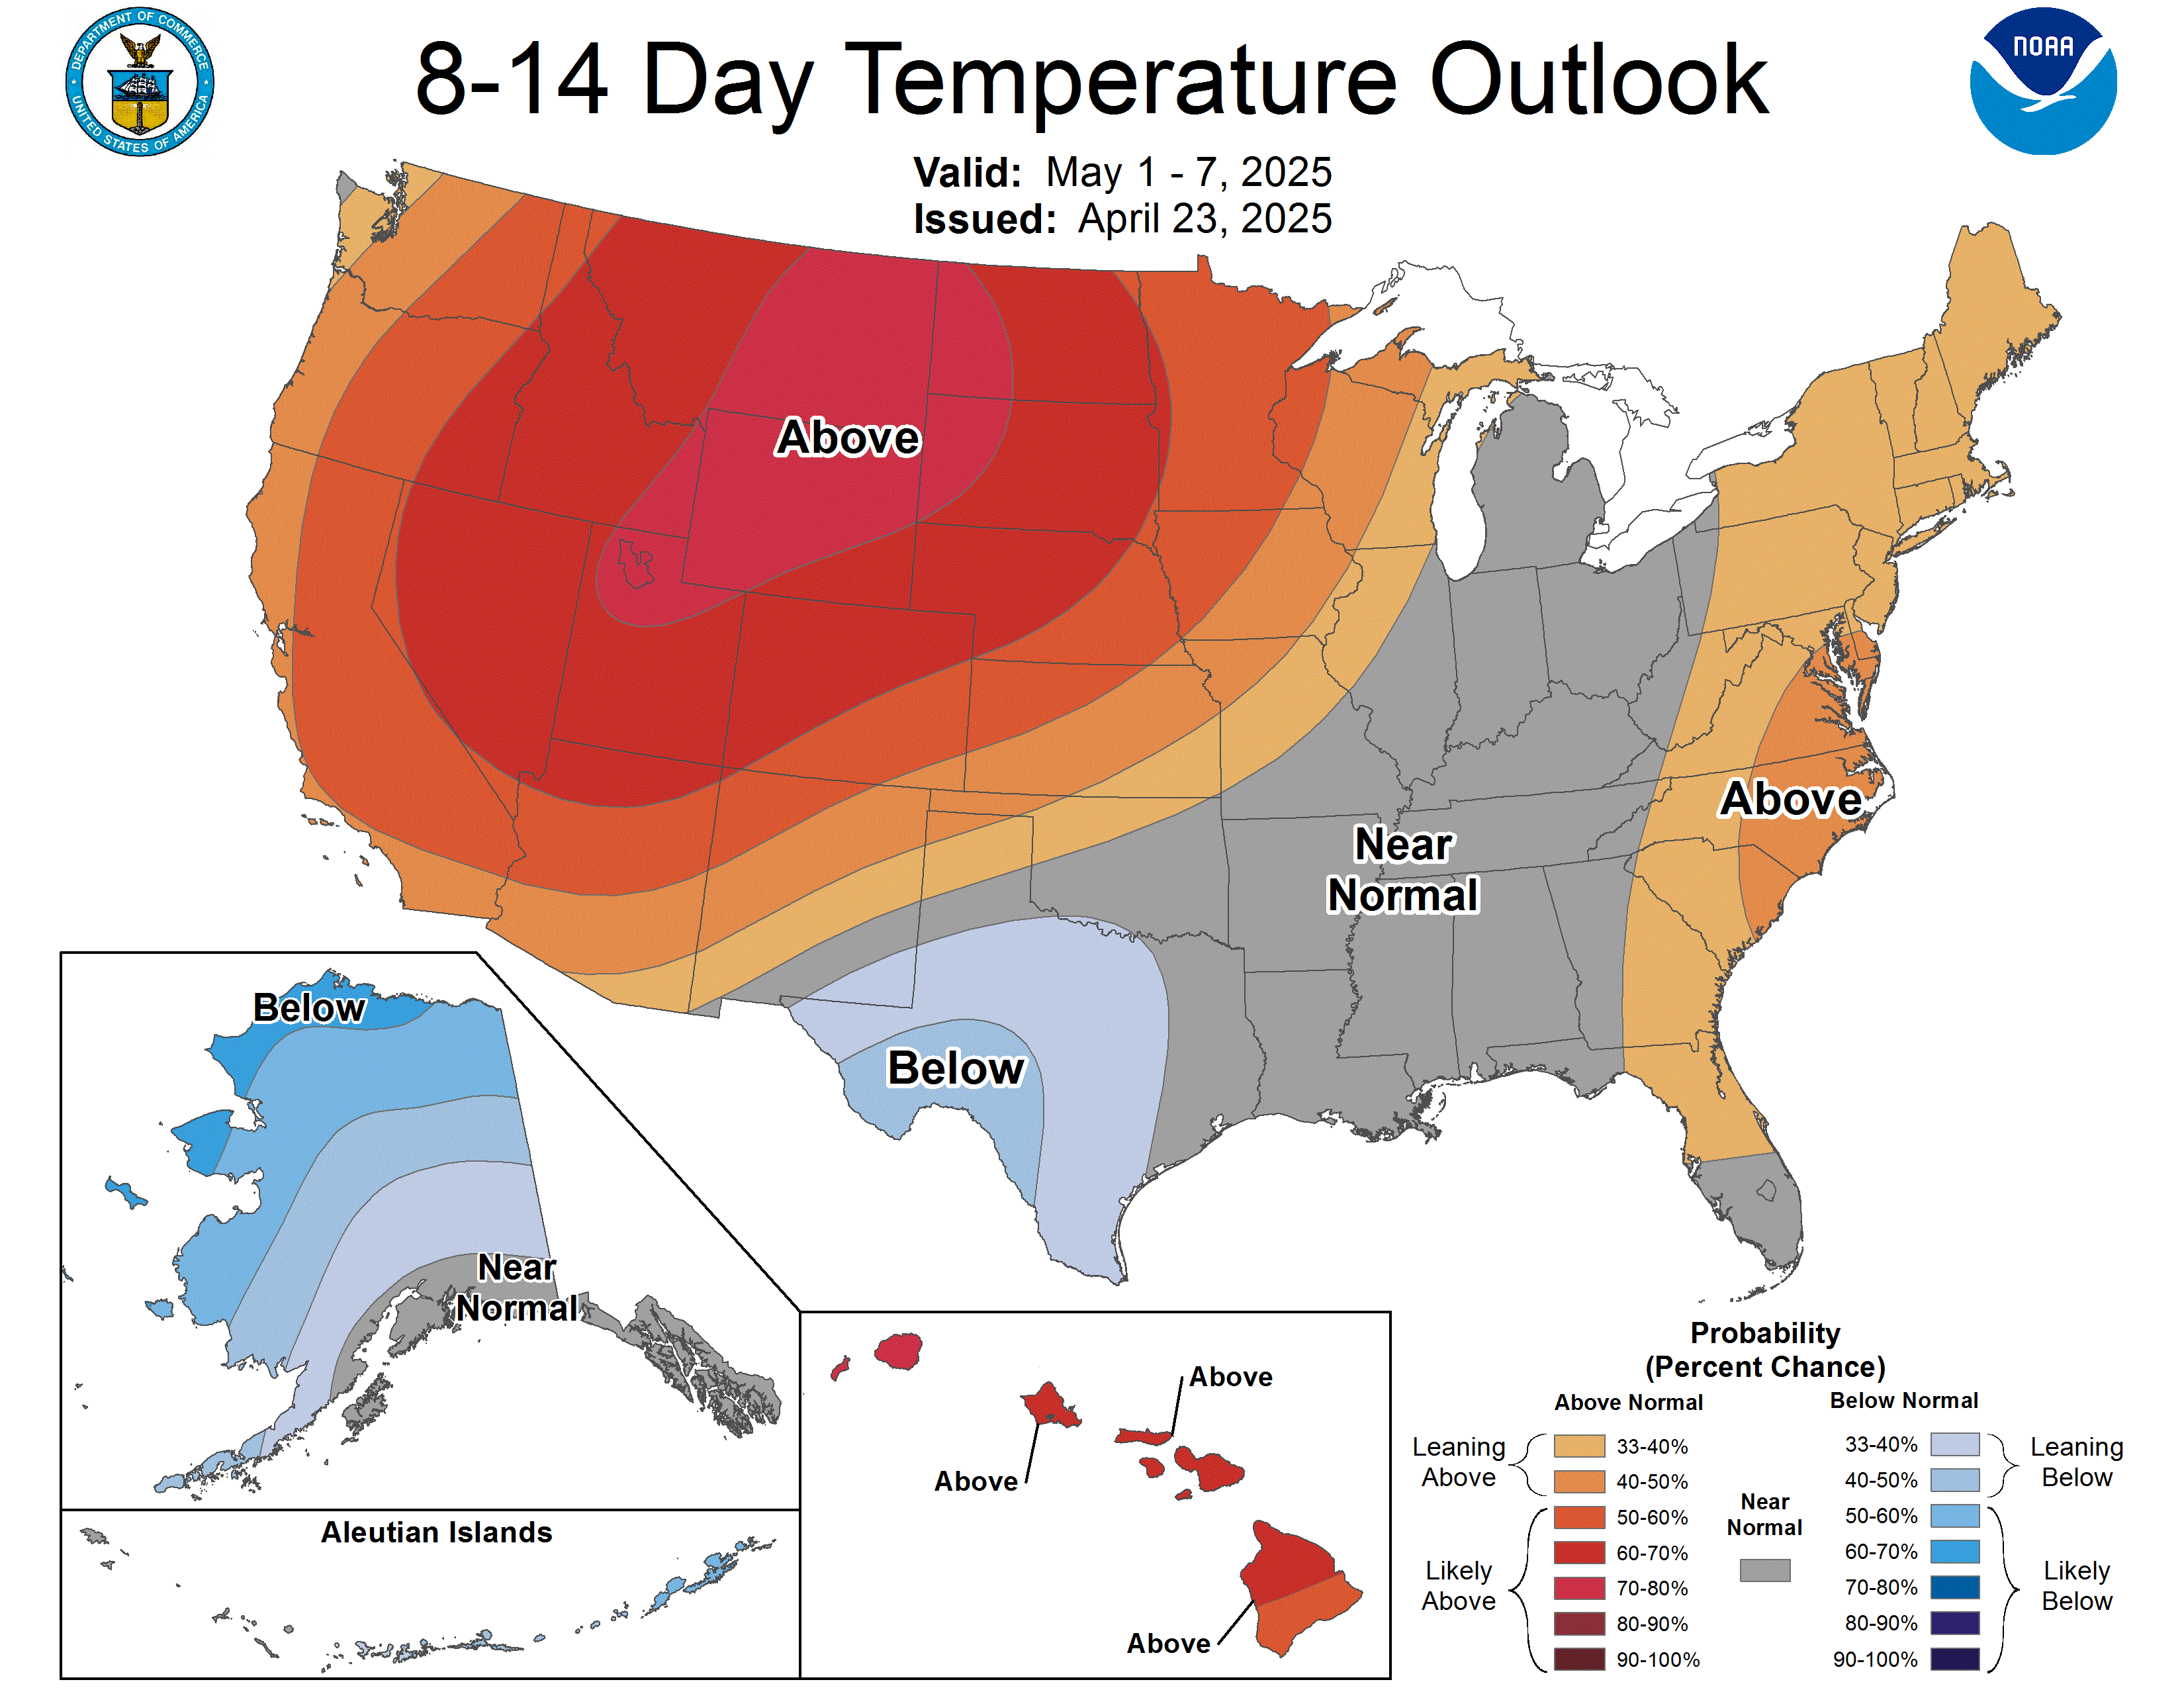
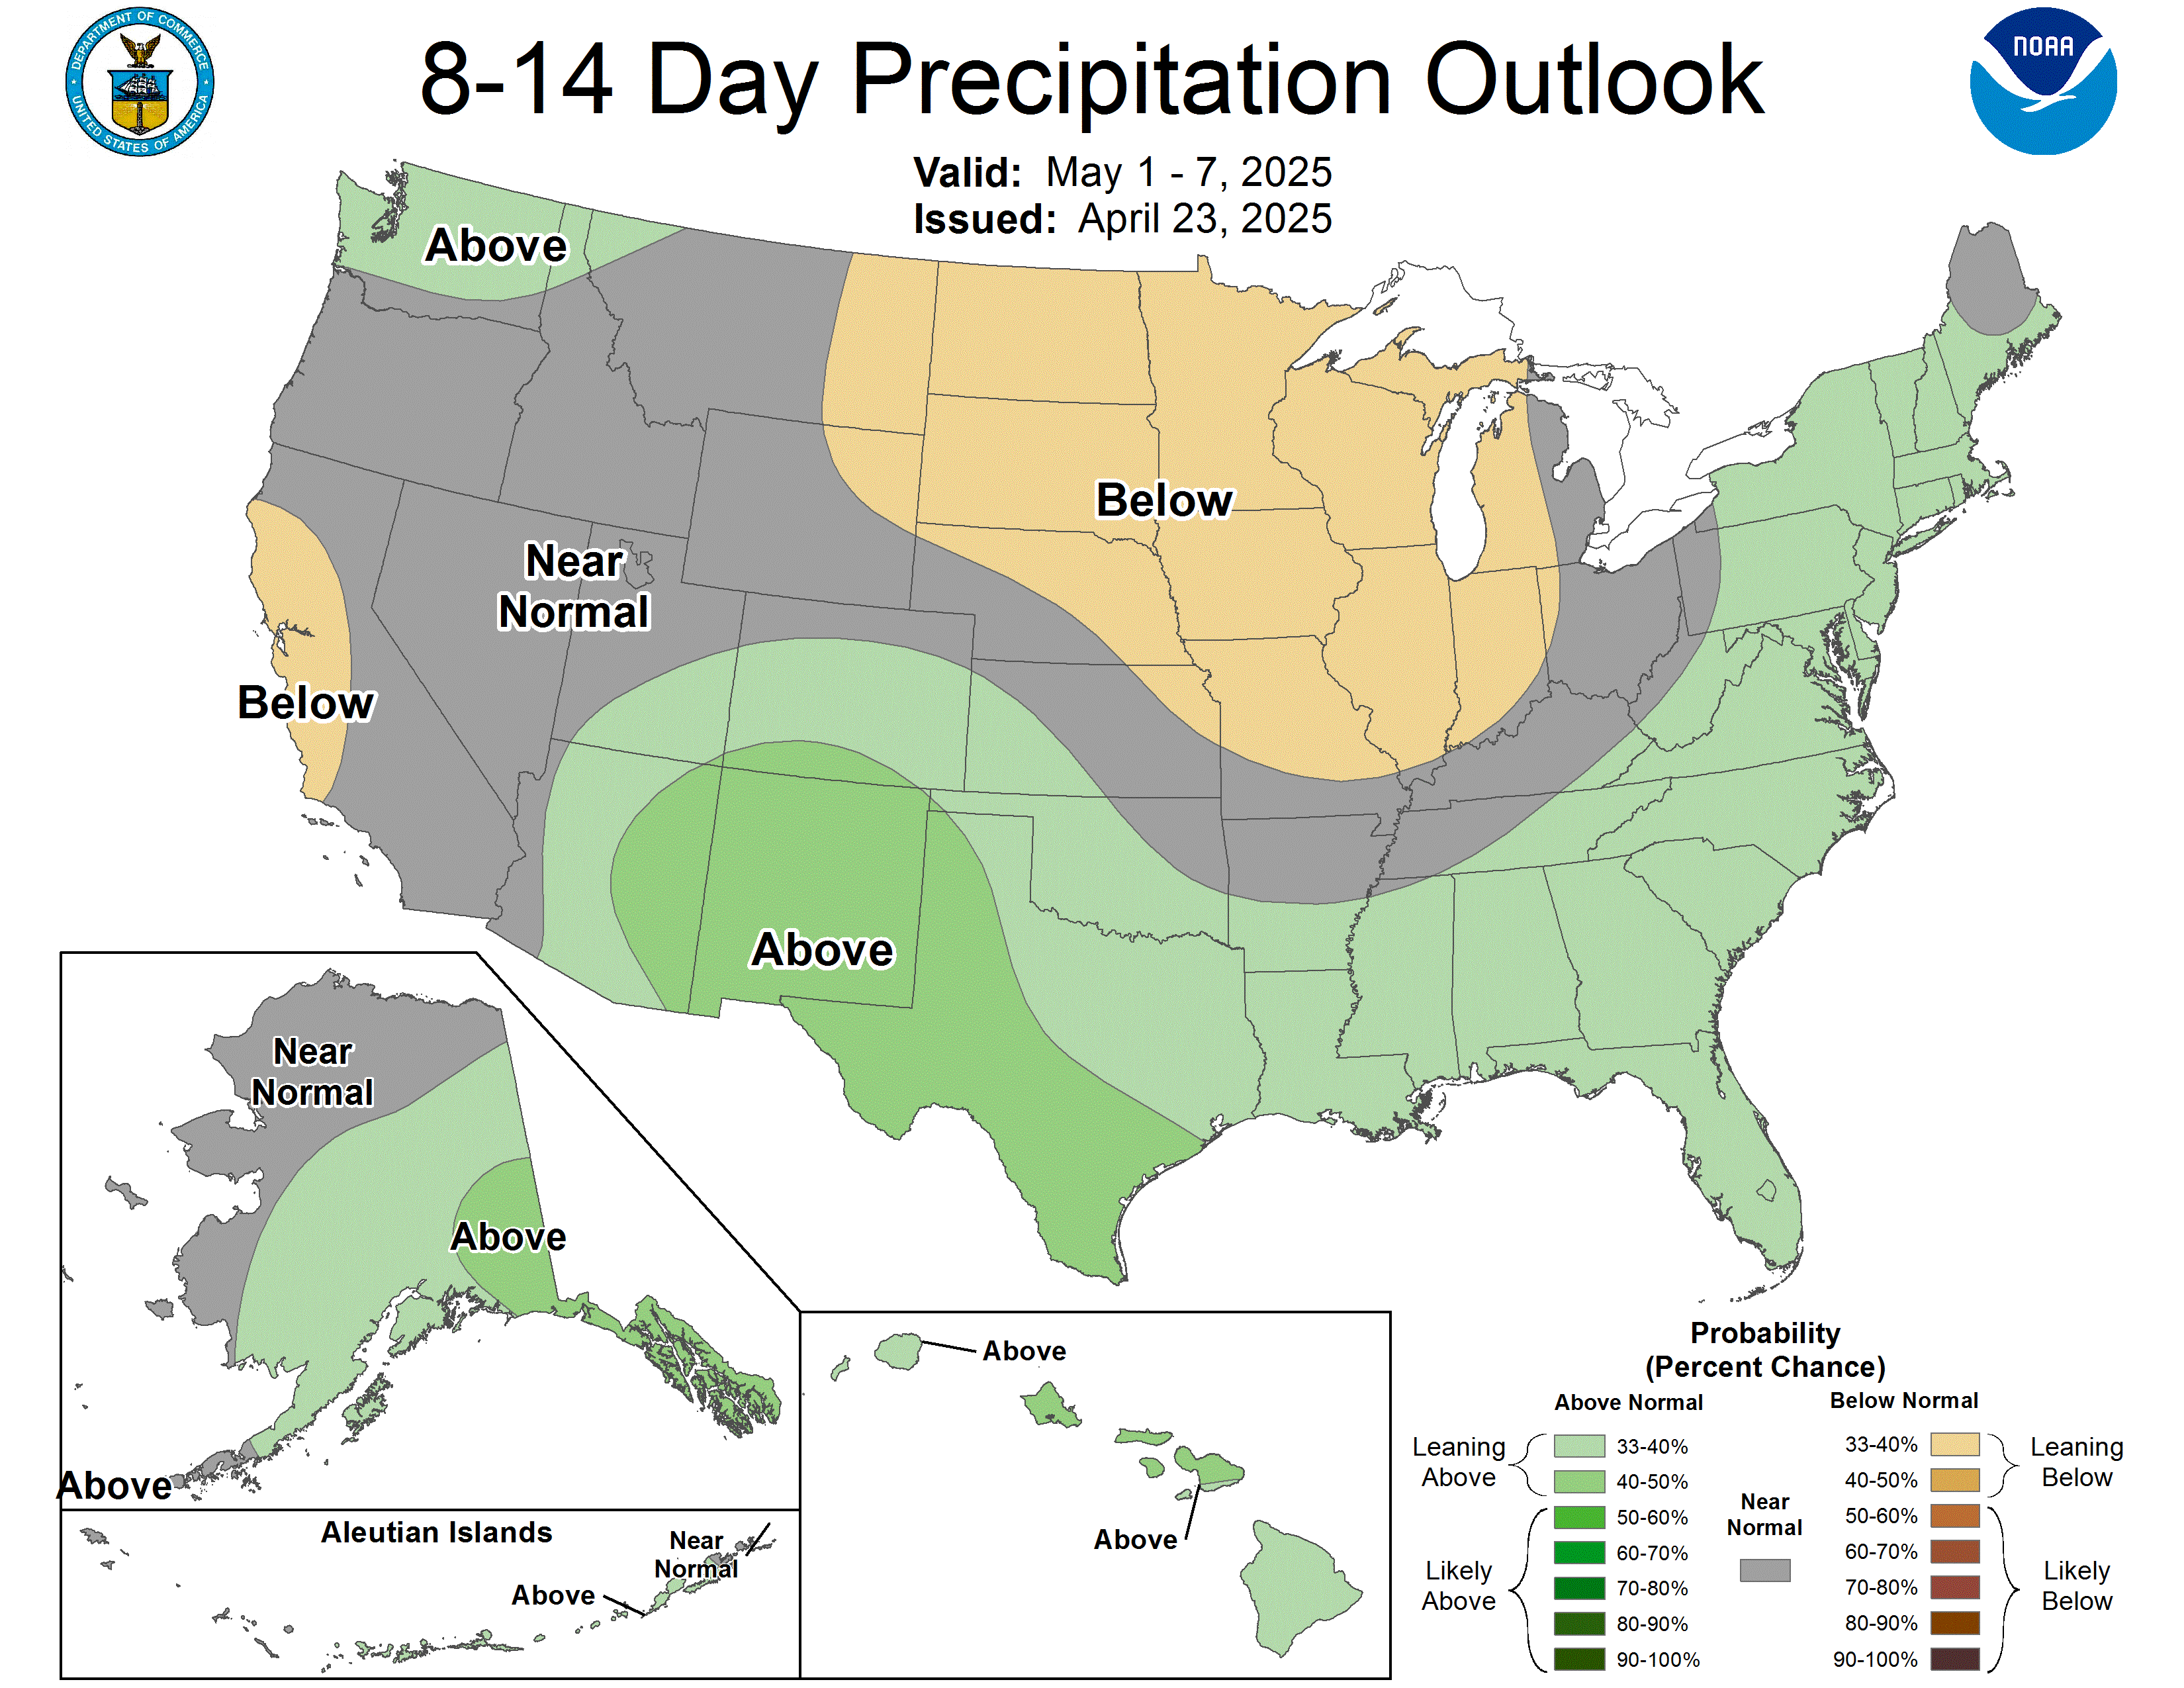
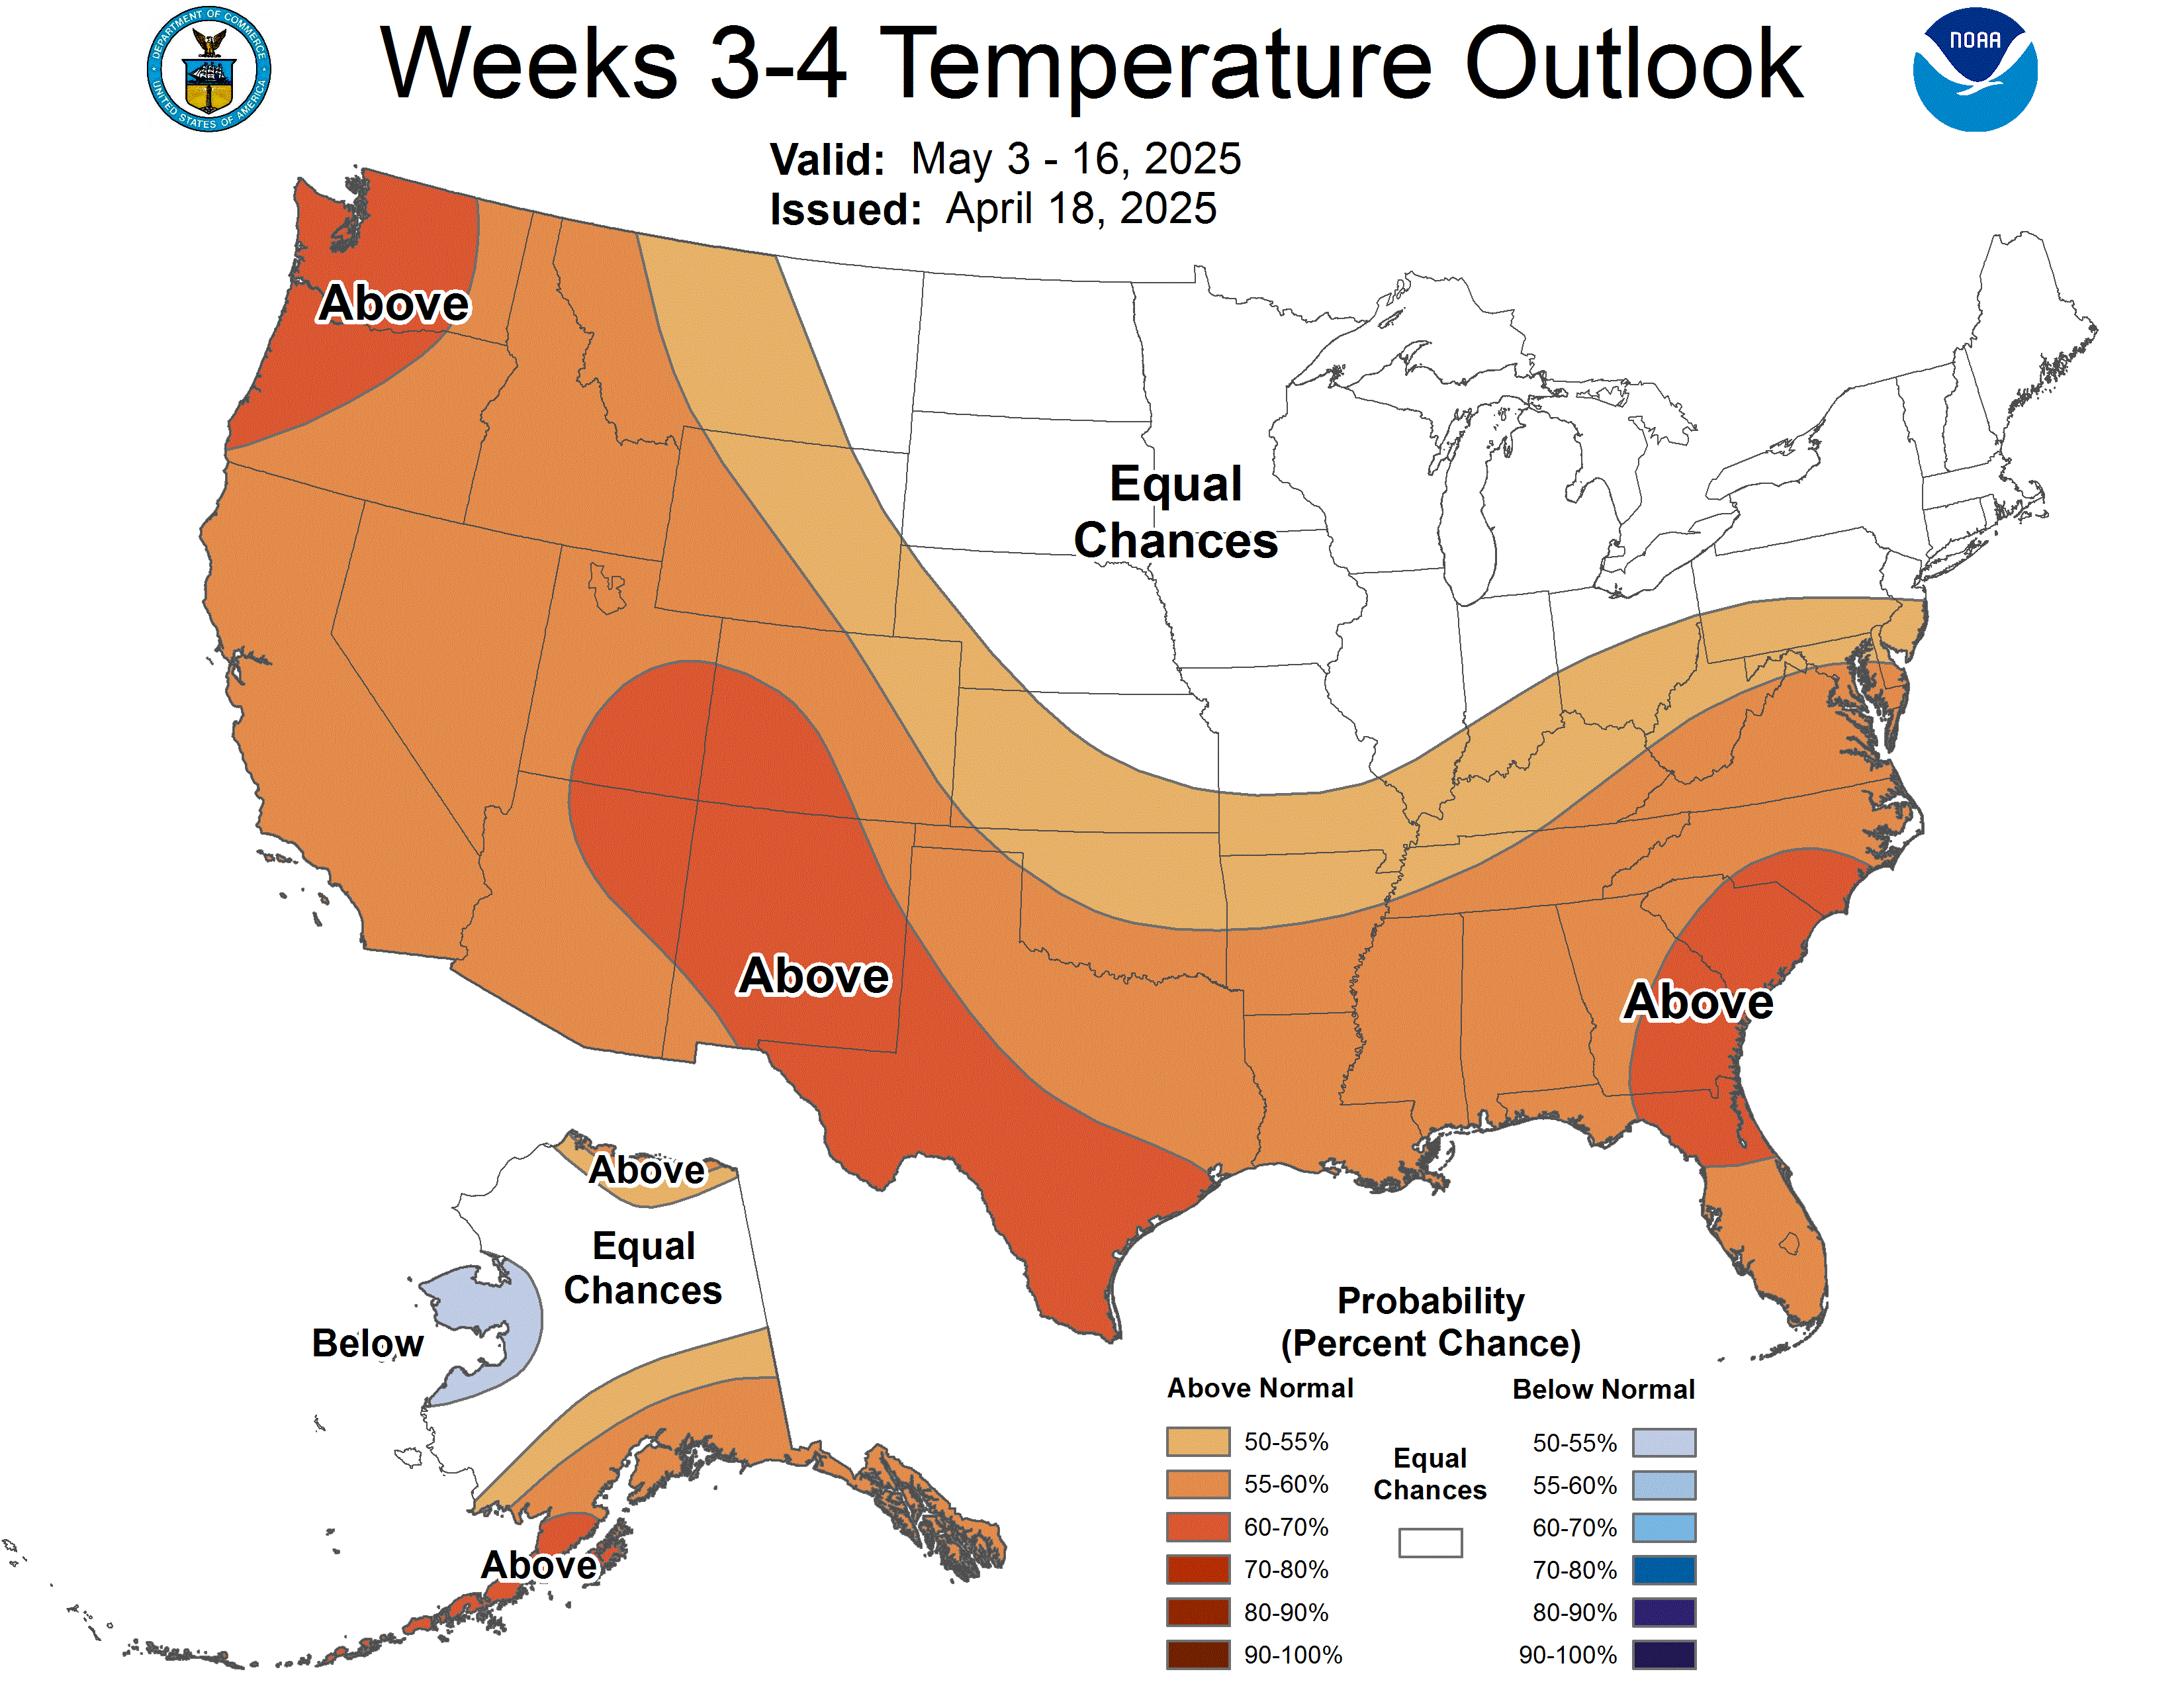
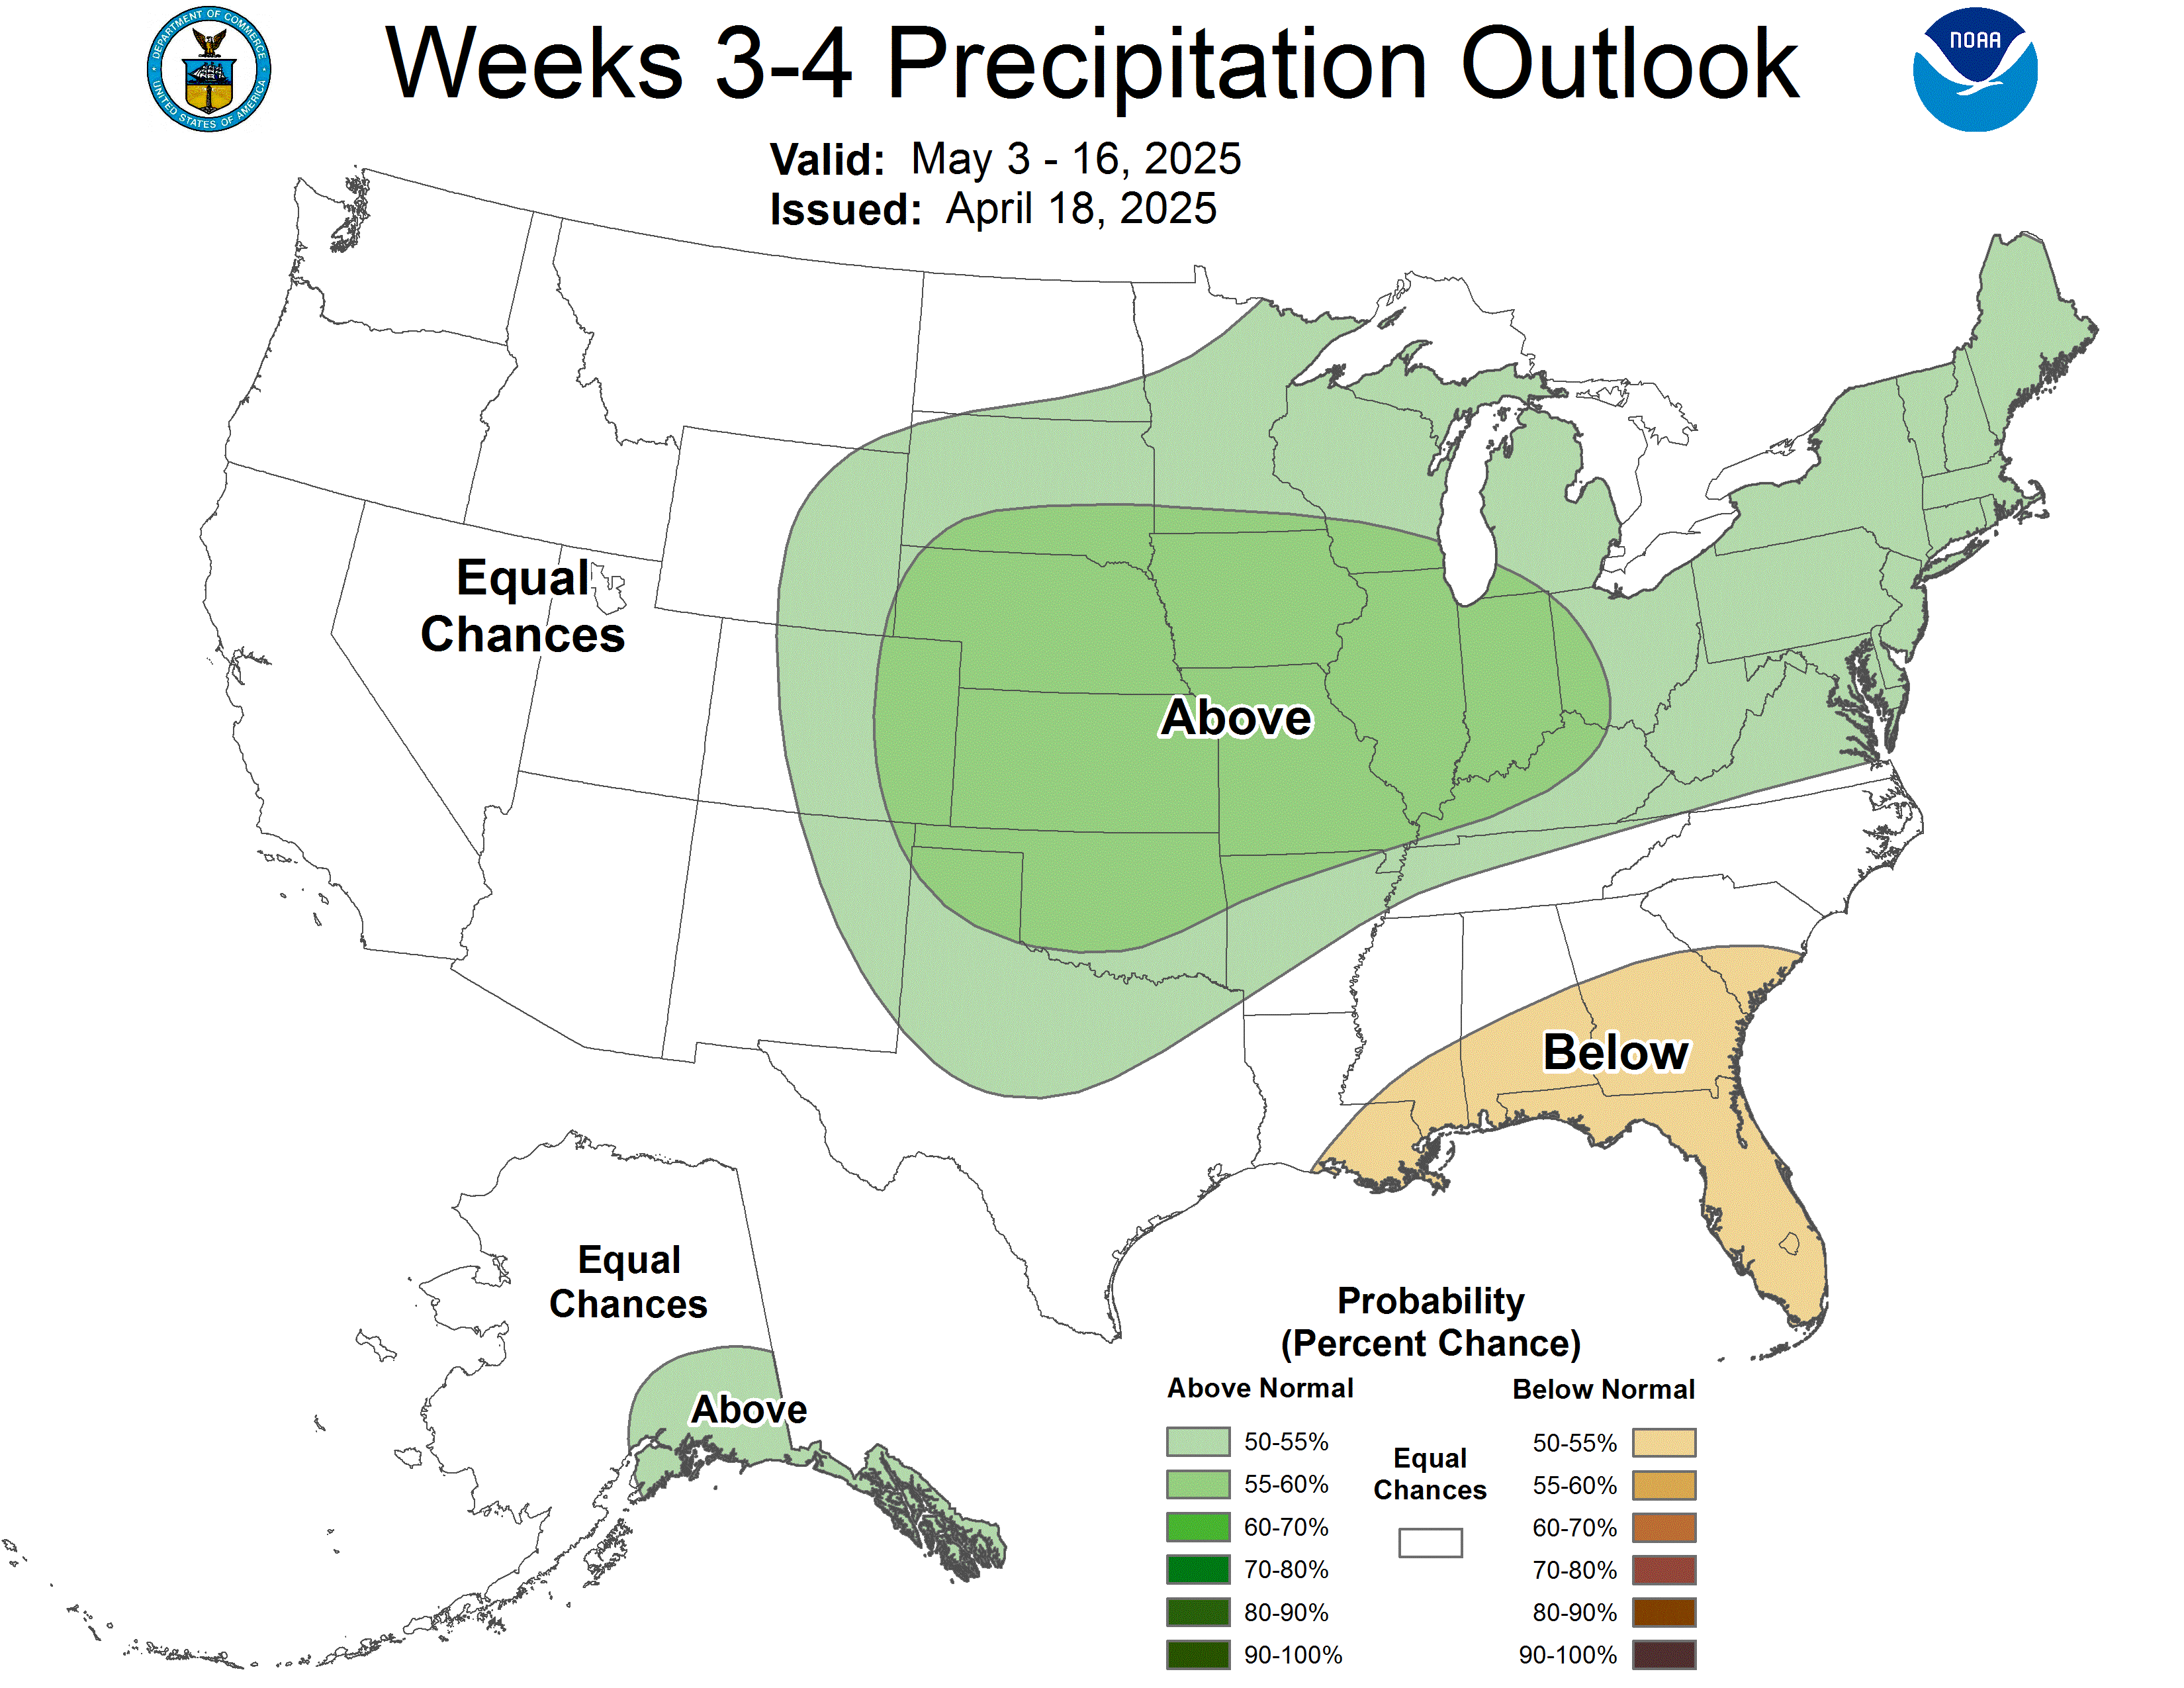
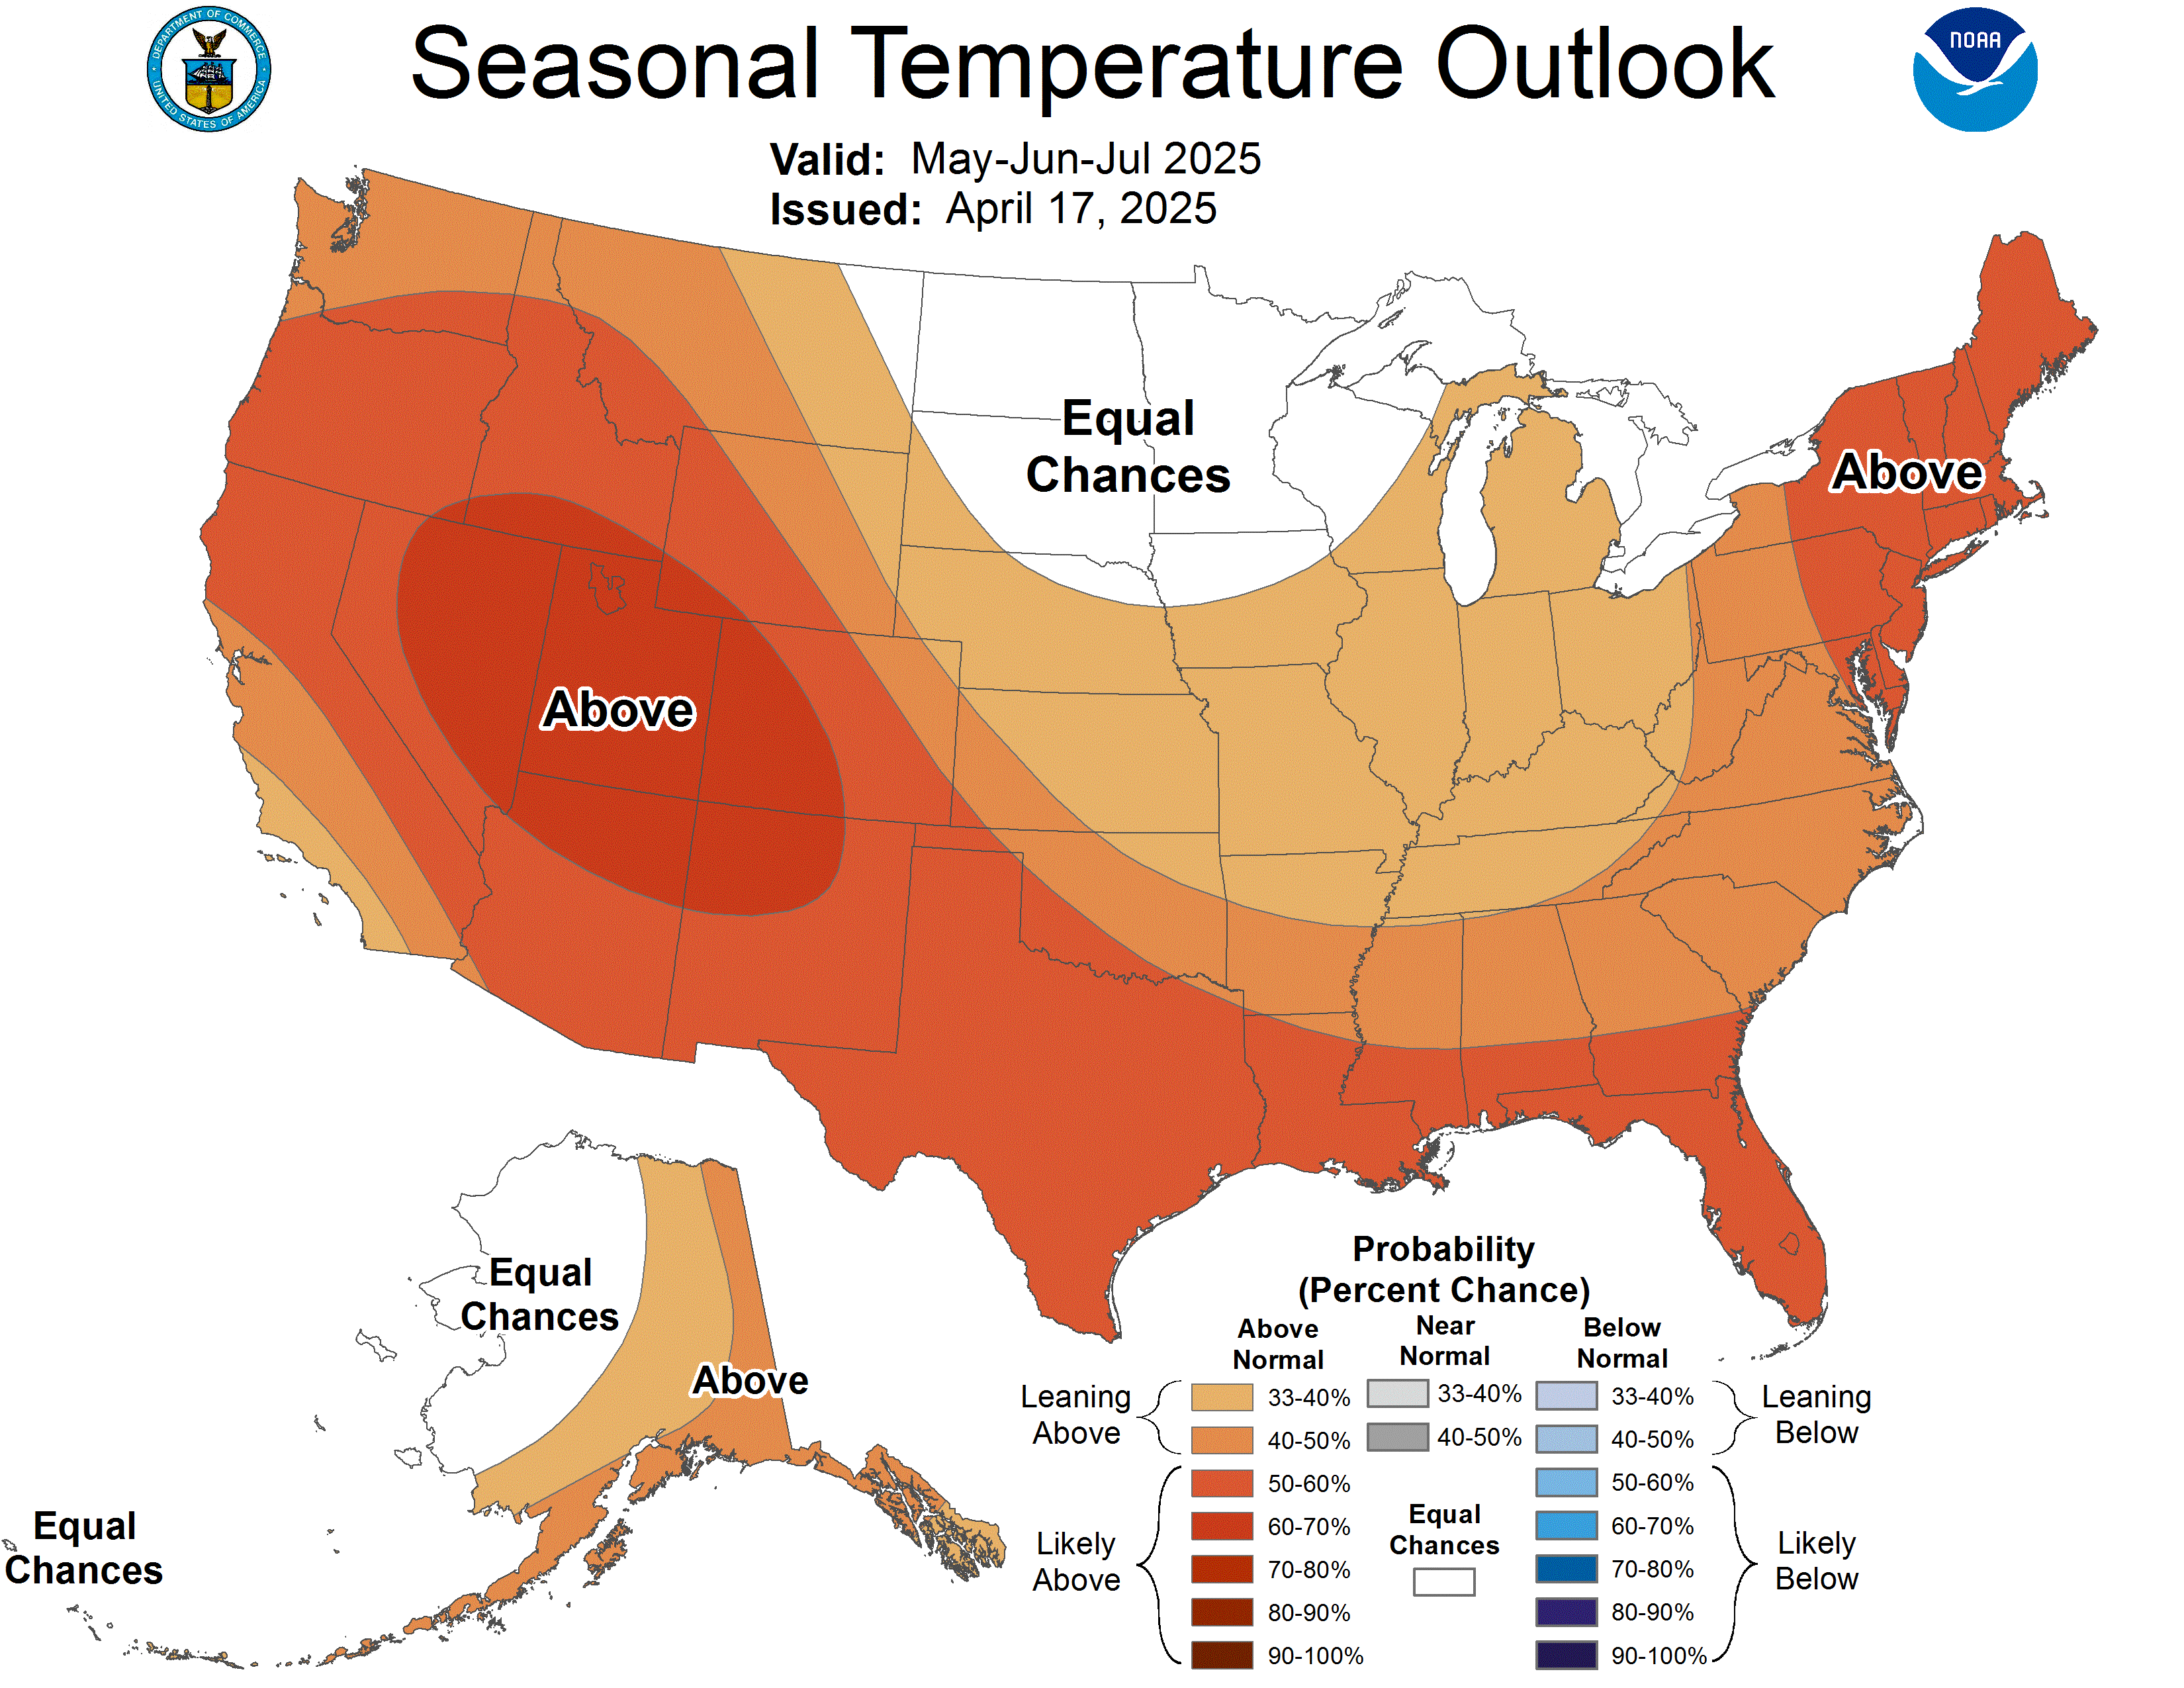
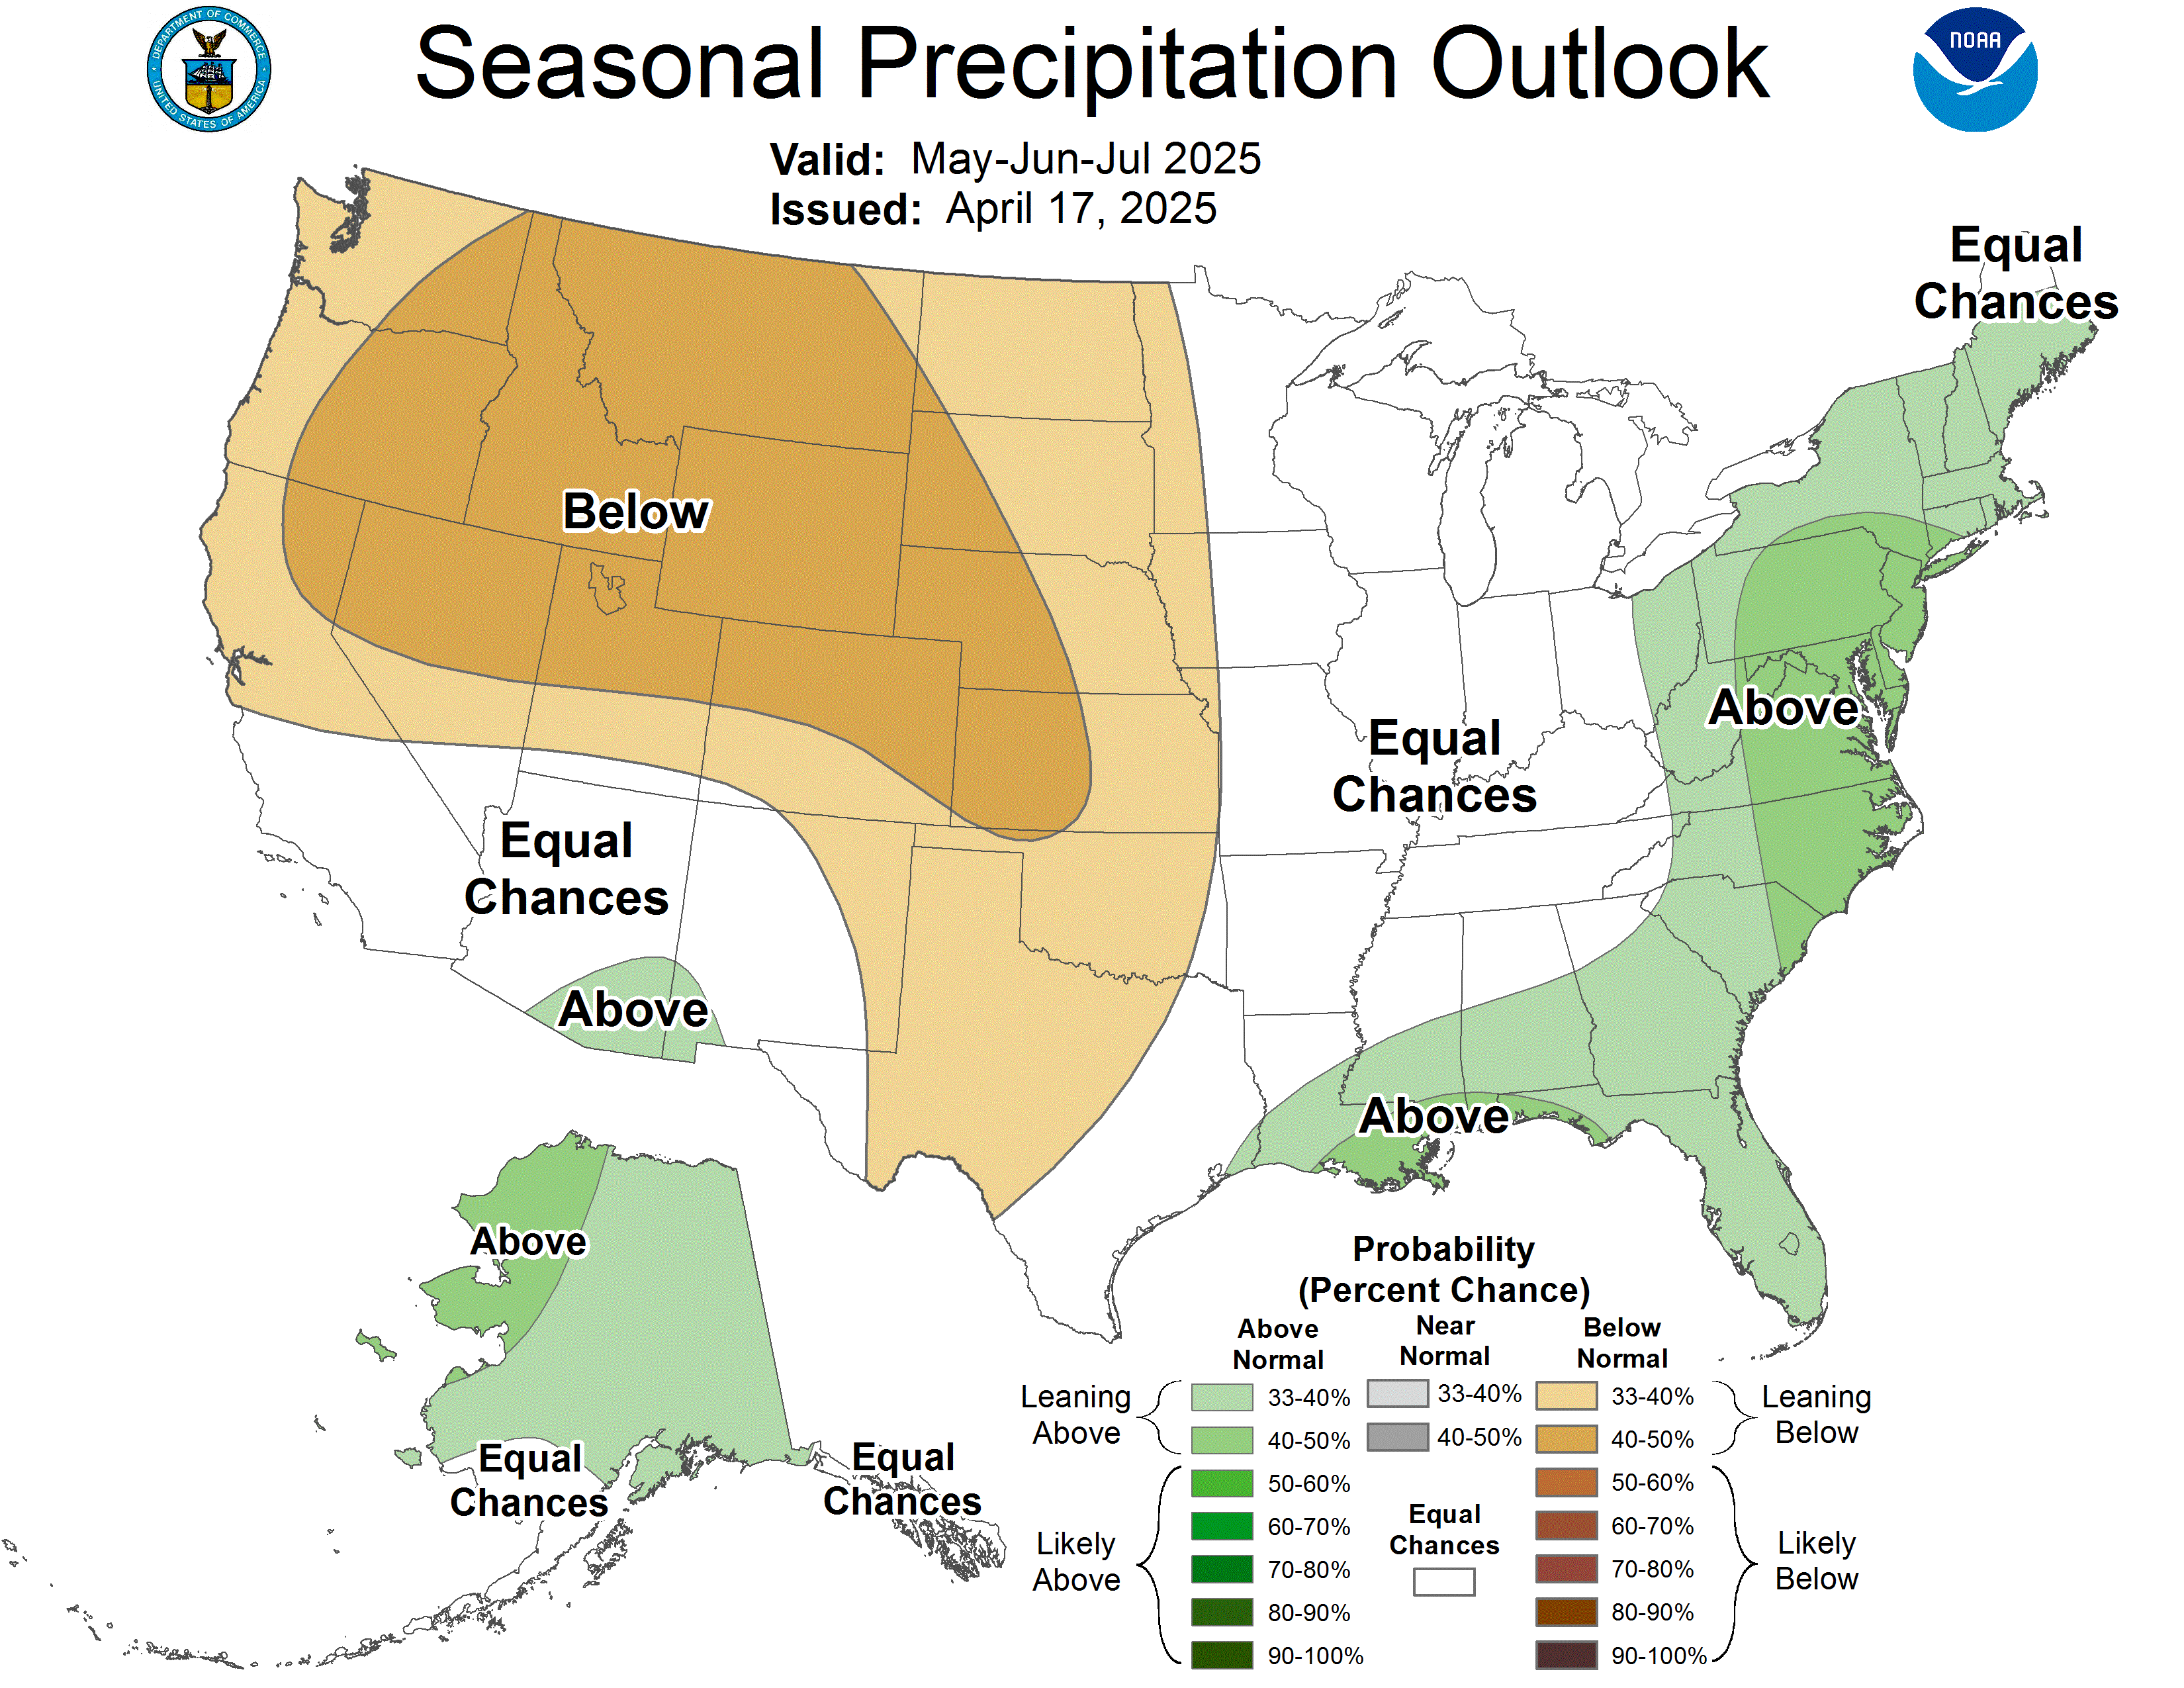
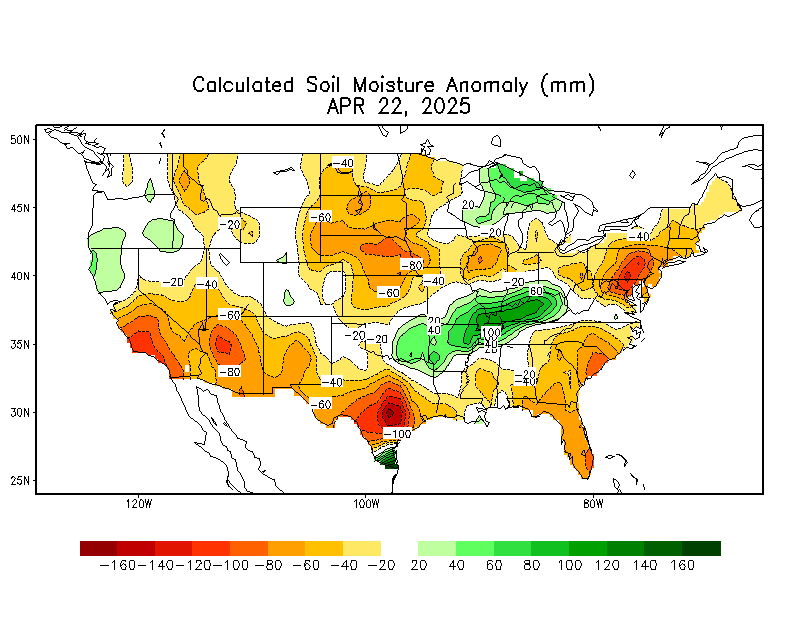
These products are from the NOAA Climate Prediction Center (CPC) and do not necessarily reflect the EPAWA forecast which is detailed above. All images below update automatically as the CPC releases new graphical products
Soil Moisture Anomaly
US Drought Monitor
Forecaster: EPAWA Meteorologist Bobby Martrich
Discussion last updated: Friday October 2nd, 2026, 10:00 AM