
EPAWA’s long range outlook is updated weekly every Friday morning before noon
Most recent update: Friday June 12th, 10:00 AM

Technical discussion for advanced readers:
The technical discussion below will feature two (2) subcategories: Precipitation, and Pattern Discussions. Storm possibilities will be discussed exclusively in the Premium Forum with intense model analysis leading up to any major snow, ice, or rain events, not publicly. To join this discussion and hear the updated thoughts from our team, visit The My Pocket Meteorologist Page by clicking HERE and select the “Premium Weather Forum” option.
Precipitation Discussion
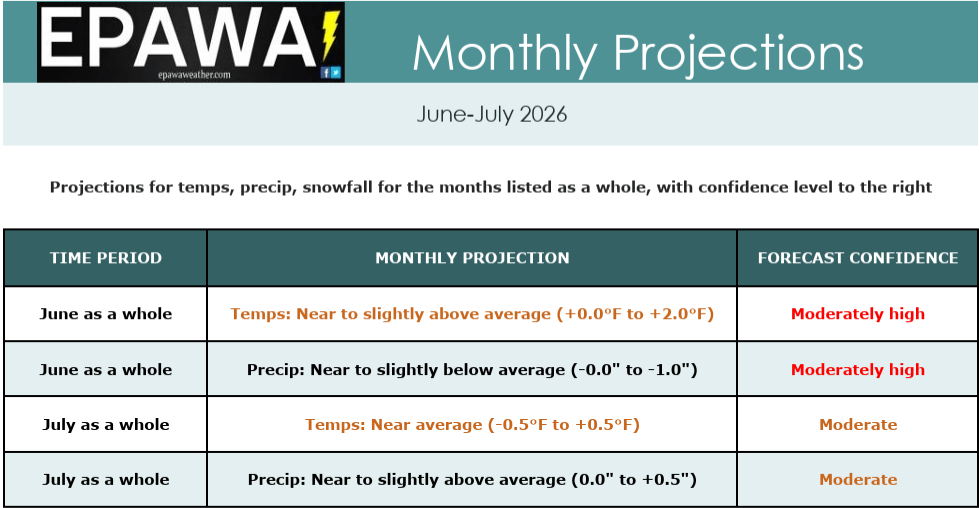
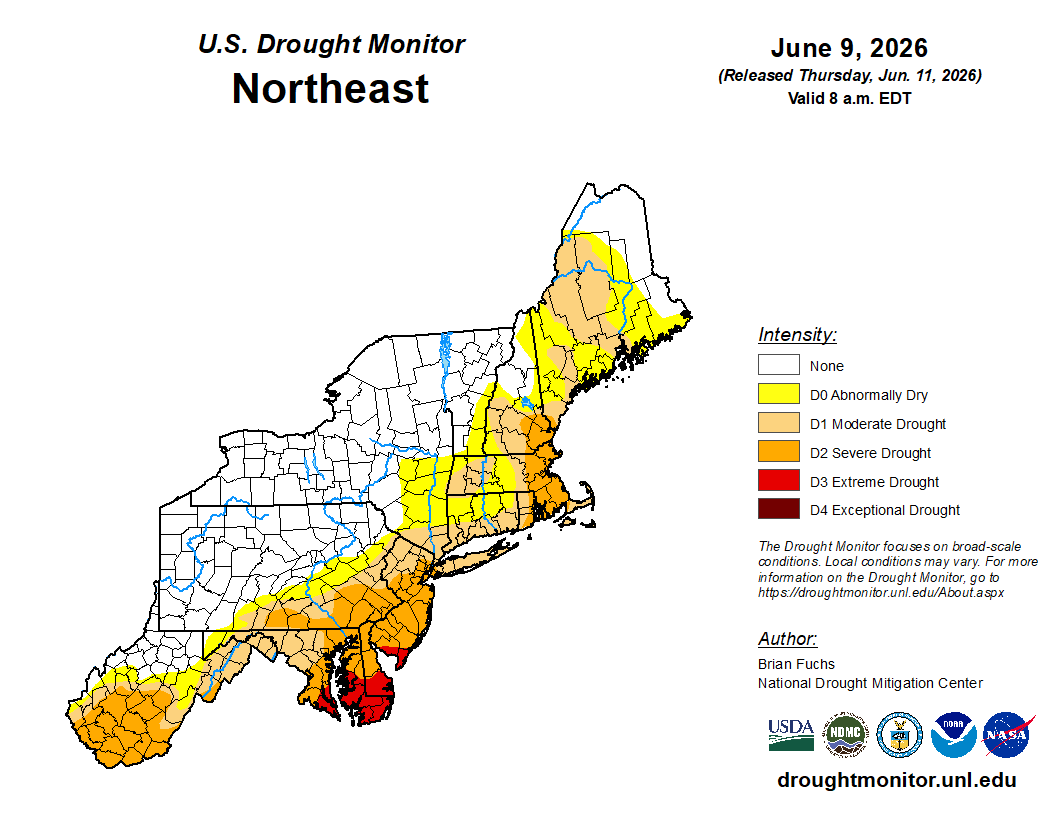
OVERVIEW: The US drought monitor (photo toward the bottom of this outlook) increased in severity from the previous week in southeastern areas, most notably across far Southern New Jersey and Delaware where the extreme drought (D3) category is now listed. Drought severity incrementally drops to lower categories farther NW into our region, and northern areas remain without a drought designation. Our projection for June is for another near to slightly below average (-0.0″ to -1.0″) precipitation departure with an especially dry first half of June, then slightly wetter than average weeks 3 and 4 of the month. July projections are cautiously optimistic, anticipating near to slightly above average (+0.0″ to +0.5″) precipitation.
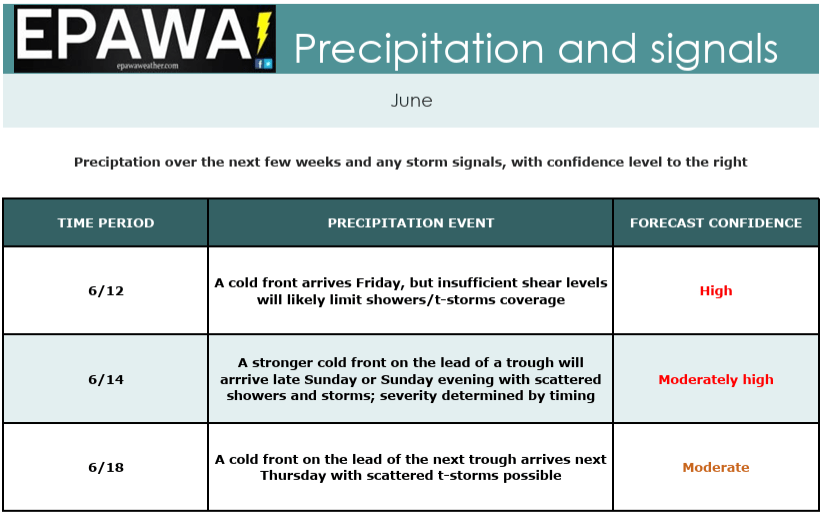
Shorter term, after a very dry overall stretch thus far in June, several cold fronts will cross the region this week. The first front crosses today with a rather ineffective amount of precipitation, with the expectation of only isolated activity. The next two fronts are stronger and hence carry better potential for more rain accompanying them, the first arriving late Sunday into Sunday night, and the 2nd front arriving later in the week on Thursday. Near average precipitation is expected in the week ahead, and the wetter conditions may follow in the week after.
Projections for the month of June were maintained this week for a near to slightly below average (-0.0″ to -1.0″) precipitation departure, with an especially dry first half of the month, and only modest recovery during the 2nd half of June. July projections anticipate near to slightly above average (+0.0″ to +0.5″) precipitation in accordance with longer term climate models and global observation trends, but this is currently met with cautious optimism.
Breakdown of precipitation departures from normal over the next several weeks:
June 13th – June 19th: Near average
June 20th – June 26th: Near to slightly above average
June 27th – July 3rd: Near to slightly below average
July 4th – July 10th: Near average
July 11th – July 17th: Near to slightly above average
July 18th – July 24th: Near to slightly above average
Public/free available maps will be updated when a threat is imminent for significant weather on the weather alerts page throughout the year: http://epawaweather.com/weather-alerts/
Note: Any image below is clickable for larger viewing
A couple of stronger cold fronts are expected follow in the week ahead which may yield more in the way of rainfall; the first arrives late Sunday, and the second is likely by next Thursday.
Pattern Discussion
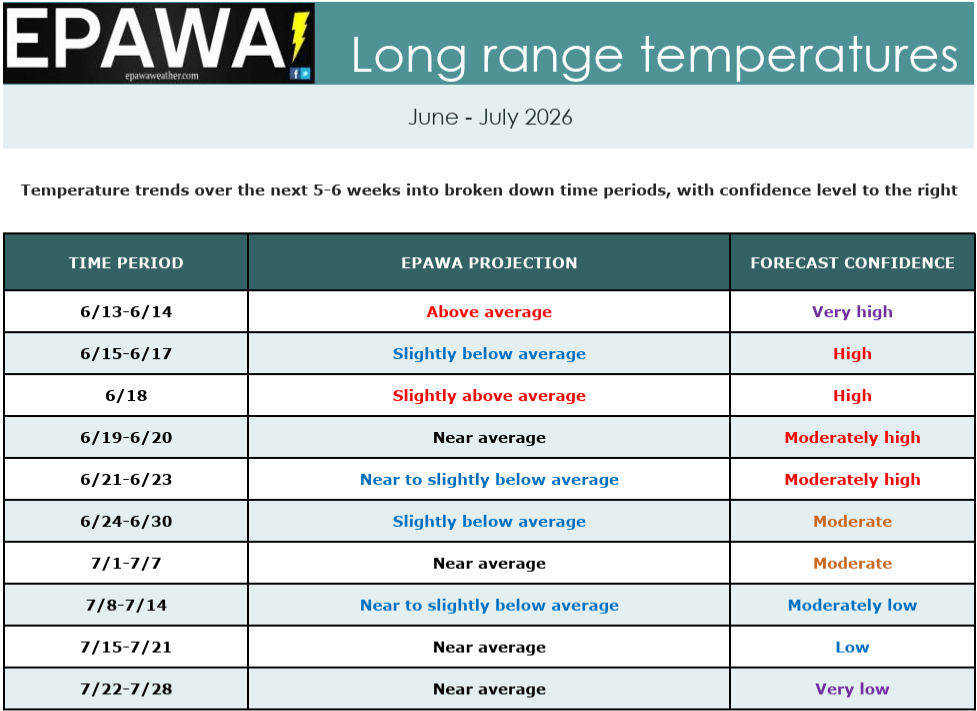
OVERVIEW: Our projections for the month of June were slightly adjusted this week to a near to slightly above average (0.0°F to +2.0°F) temperature departure, with ridging continuing through this weekend, then largely near to slightly cooler than average over much of the 2nd half of June. July projections were maintained this week for a near average (-0.5°F to -0.5°F) temperature departure using long term climate guidance and global observation trends.
- June will be warmer than average through this weekend and one day next week ahead of a cold front, but generally near to slightly below average over the remainder of the month. Despite this late month “cooler” period relative to average, the month is still likely to finish near to slightly above average thanks to ridging dominating the first half of June. Although there can be shorter term temperature fluctuations above or below average in July, the larger picture of month as a whole is more likely to follow the Summer El Niño paradigm, and fairly close to average temperatures.
- The Madden-Julian Oscillation (MJO) is currently in phase 8 in the Western Hemisphere, and is expected to move into phase 1 over the next week or so before collapsing into the Circle of Death (COD) or NULL phase, maintaining there through at least through the end of June. This propagation would suggest a near to slightly below average temperature pattern late June and July as we transition from ENSO neutral to El Niño.
- A composite average of the SST departures in the ENSO regions places it in El Niño territory currently. From west to east across the Pacific, the Niño 4 (west-central Pacific) is currently +1.3°C, and the Niño 3.4 region (east-central Pacific) is currently at +1.4°C. The eastern regions of Niño 3 (east-central Pacific) is currently +1.6°C, and Niño 1+2 region (near the Peruvian coast) is at +2.8°C as of June 10th. The threshold for El Niño begins at +0.5°C as a composite average of the ENSO regions, and although not officially declared by the CPC, it is the expected transition, and an El Niño Summer and Fall will follow. There are delayed El Niño effects to our sensible weather pattern, and that transition is expected in July with a more typical El Niño Summer paradigm.
- Chatter has been surrounding the potential for a “Super” El Niño and one of the strongest El Niño episodes on record heading into the Fall and Winter months. While this is indeed a possibility, there is still a large spread and uncertainty among climate model guidance regarding the intensity of El Niño at that time. This chatter has gained traction through various media sources, but it is simply too early to call in terms of how strong El Niño will eventually get… and henceforth the downstream implications on Fall and Winter are also unknown variables at this time. We will continue to monitor in the months ahead.
Average high temperatures are currently in the 79-82°F range from north to south across our coverage region, which is about 2°F higher than at this point last week. Climatological annual maximum temperatures will be achieved in mid-July. Any above or below average stretches listed in the outlook will be relative to seasonal norms at that time, and it is important to note that cooler/warmer periods will be relative to the time of year we are talking about. For example, the above average temperatures listed for this weekend features highs in the 85-90° range, coming at a time when average highs are in the lower 80s. Use the average highs/lows chart below providing transparency for what average temperatures are expected to be at each corresponding location through August 1st.
The projections for the month of June were slightly adjusted this week to a near to slightly above average (+0.0°F to +2.0°F) temperature departure, with a ridging continuing through this weekend, then largely near to slightly cooler than average over much of the 2nd half of June. July projections were maintained this week for the same near average (-0.5°F to +0.5°F) temperature departure using long term climate guidance and global observation trends.
Note: Any image below is clickable for larger viewing
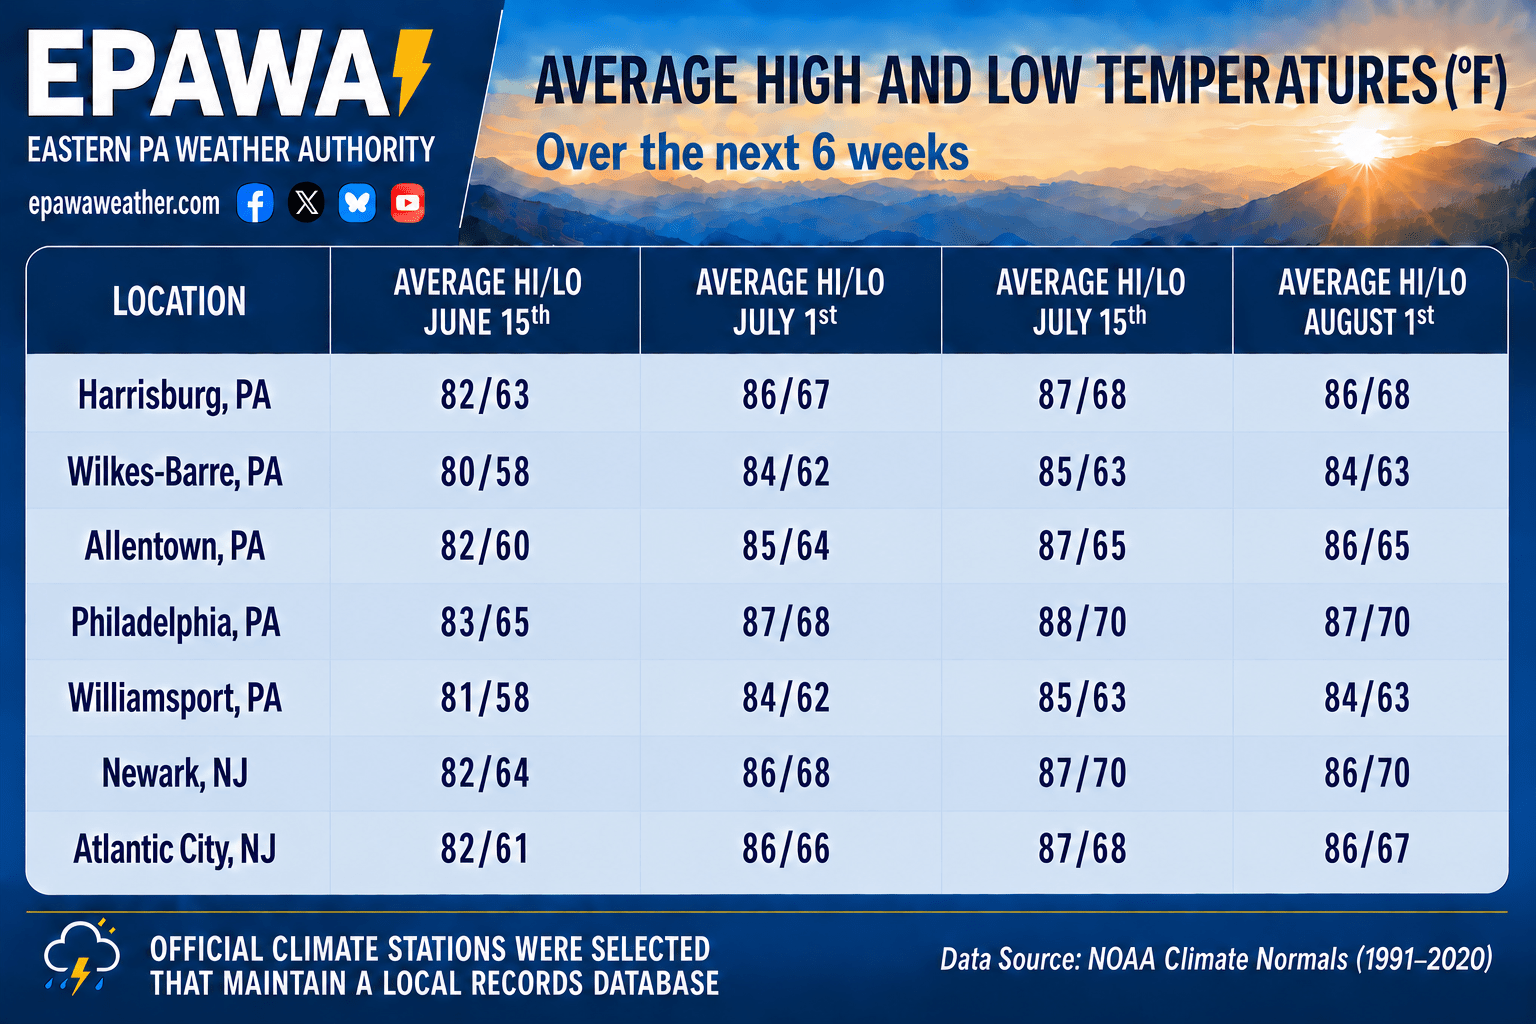
Average temperatures at our major climates stations across the region are shown over the next 6 weeks, leading up to annual climatological maximum temps achieved in mid-July.
Our Long Range Projections
Projections last updated: Friday June 12th. Next scheduled update: Friday June 19th
Climate Prediction Center (CPC) Products
These products are from the NOAA Climate Prediction Center (CPC) and do not necessarily reflect the EPAWA forecast which is detailed above. All images below update automatically as the CPC releases new graphical products


Soil Moisture Anomaly

US Drought Monitor
Forecaster: EPAWA Meteorologist Bobby Martrich
Discussion last updated: Friday June 12th, 2026, 10:00 AM