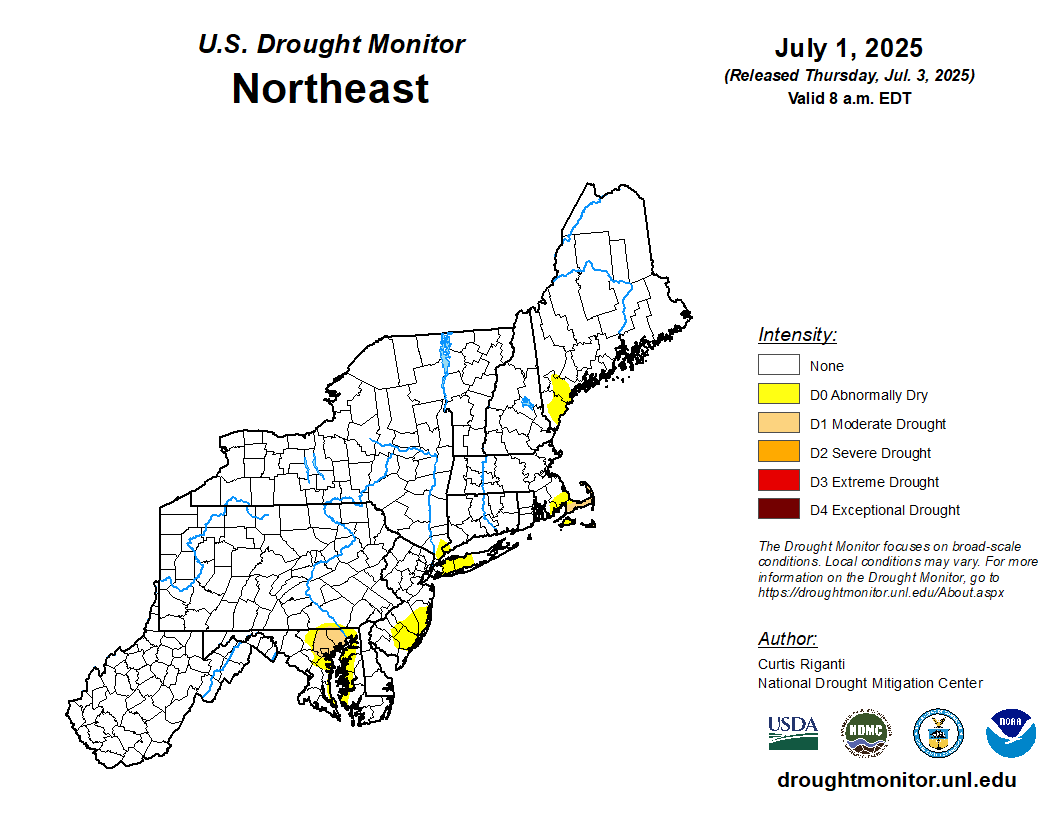
OVERVIEW: The US drought monitor (photo toward the bottom of this outlook) maintains NO drought areas within our Pennsylvania, New Jersey, or Delaware locales. One moderate drought area remains over Baltimore and Harford Counties in Maryland, otherwise much of Maryland has also improved significantly. This is largely due to quite an impressive month of May with a top 5 rainfall month all-time in some locations, and generally near average precipitation following in June. Going forward, the month of July projections were maintained this week for a near to slightly above average (+0.0" to +1.0") precipitation departure for the month as a whole. August monthly projections were introduced this week for a slightly above average (+0.5" to +1.5") precipitation projection in accordance with longer term climate models and notoriously wetter Augusts historically within the past decade within a ENSO neutral Summer background state.
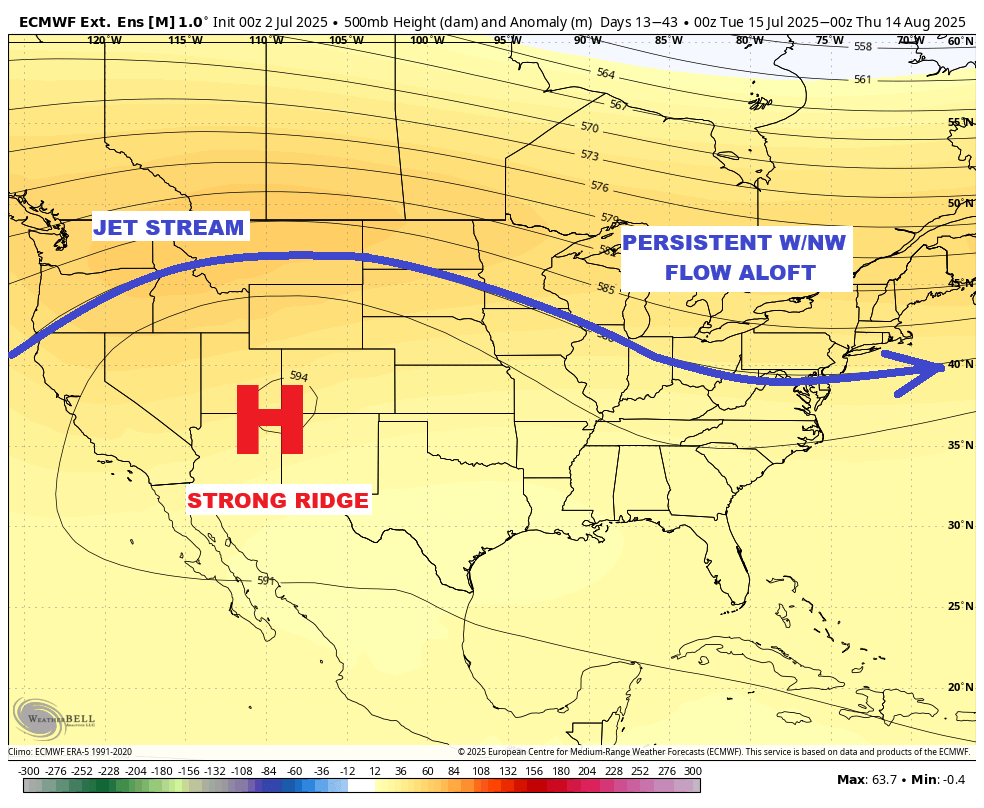
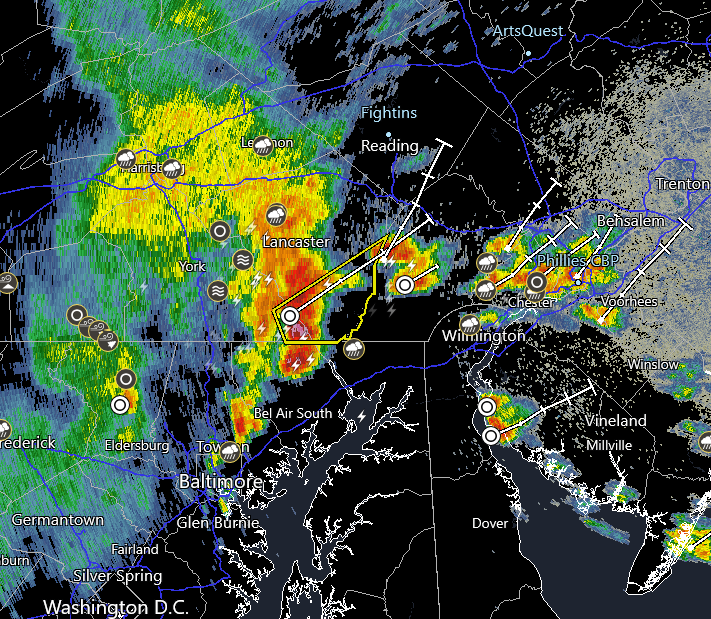
Shorter term, a cold front in association with an upper-level trough will move through Thursday afternoon and evening with a semi-congealed line of thunderstorms, then clears overnight setting up a dry holiday weekend. The next stronger cold front is due to arrive Tuesday with scattered showers and thunderstorms accompanying the boundary. A third cold front arrives late next week with additional scattered showers and storms possible. The overall pattern going forward through mid-August features more of a NW flow aloft, which will increase chances of cold fronts and storm chances every 2-3 days.
The month of July projections were maintained this week for a near to slightly above average (+0.0" to +1.0") precipitation departure, with the expectation that overall precipitation events and frequency will increase from week 2 of July onward. The month of August projections for the month as a whole were introduced this week for a slightly above average (+0.5" to +1.5") precipitation departure, using longer term climate models as well as seasonal trends.
Breakdown of precipitation departures from normal over the next several weeks:
July 5th - July 11th: Near average
July 12th - July 18th: Slightly above average
July 19th - July 25th: Near to slightly above average
July 26th - August 1st: Near to slightly above average
August 2nd - August 8th: Slightly above average
August 9th - August 15th: Slightly above average
Public/free available maps will be updated when a threat is imminent for significant weather on the weather alerts page throughout the year: http://epawaweather.com/weather-alerts/
Note: Any image below is clickable for larger viewing