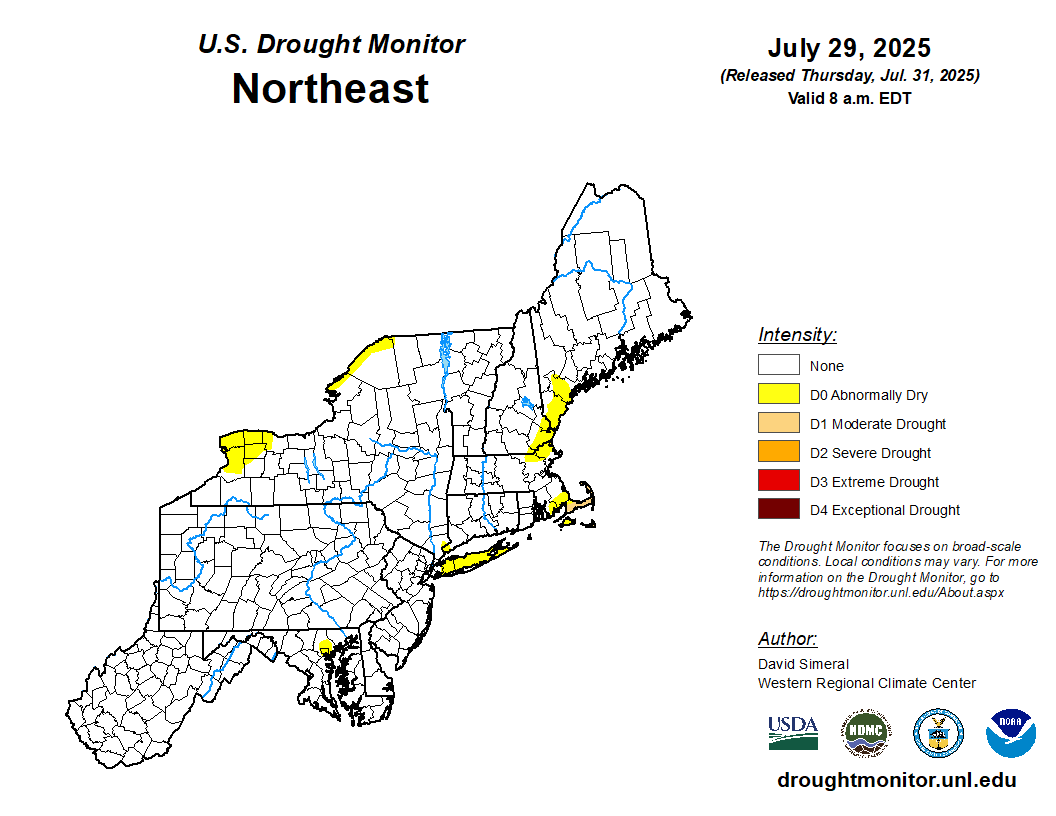
OVERVIEW: The US drought monitor (photo toward the bottom of this outlook) maintains NO drought areas within our Pennsylvania, New Jersey, or Delaware locales. One abnormally dry area remains over Southern Baltimore County in Maryland, otherwise the remainder of Maryland has no drought designation. This is largely due to quite an impressive month of May with a top 5 rainfall month all-time in some locations, and generally near average precipitation following in June and July. Going forward, the month of August as a whole projections were maintained this week at a near average (-0.5" to +0.5") precipitation departure for the month as a whole. September monthly projections were introduced this week for a near to slightly below average (0.0" to -1.0") precipitation projection in accordance with longer term climate models and global observation trends.
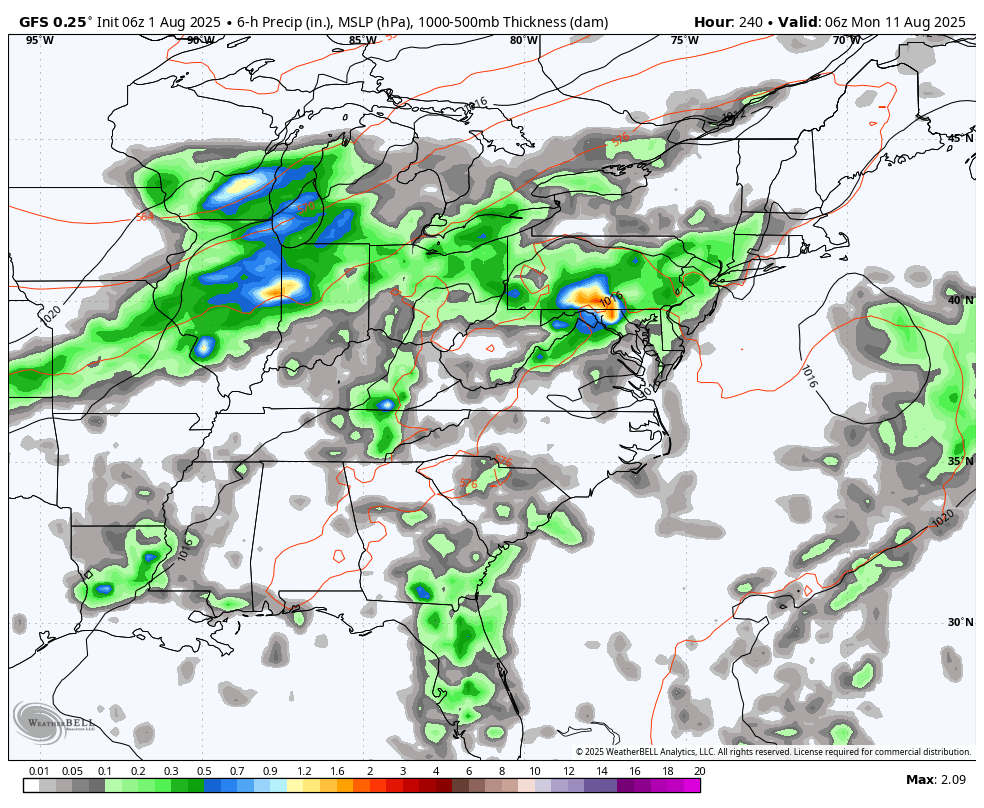
Shorter term, a dry week is expected to begin August with high pressure dominating through at least midweek next week. As high pressure shifts offshore mid to late week next week, an area of low pressure may develop in response to a 500mb trough approaching from the west. This is currently modeled to graze the coastline in the Thursday night and Friday time frame, and could bring at least some shower activity to mainly our southeastern areas. Following this system we expect a warm front to approach either late Sunday or Sunday night with showers and perhaps thunderstorms. Given the lead time and timing uncertainty, the threat period was spread over two days - Sunday and/or Monday of the following week.
The month of August projections were maintained this week for a near average (-0.5" to +0.5") precipitation departure, with the expectation that we'll see a dry start and end to the month, with a slightly wetter than average middle two weeks of the month presently. The month of September projections for the month as a whole were introduced this week to a near to slightly below average (0.0" to -1.0") precipitation departure, using longer term climate models as well as seasonal trends.
Breakdown of precipitation departures from normal over the next several weeks:
August 2nd - August 8th: Below average
August 9th - August 15th: Near to slightly above average
August 16th - August 22nd: Near to slightly above average
August 23rd - August 29th: Near to slightly below average
August 30th - September 5th: Near average
September 6th - September 12th: Near to slightly below average
Public/free available maps will be updated when a threat is imminent for significant weather on the weather alerts page throughout the year: http://epawaweather.com/weather-alerts/
Note: Any image below is clickable for larger viewing