EPAWA's Long Range Outlook
EPAWA's long range outlook is updated weekly every Friday morning before noon
Long range outlook most recently updated Friday June 6th, 10:15 AM

Technical discussion is below for advanced readers:
Technical discussion below will feature two (2) subcategories: Precipitation, and Pattern Discussion. Storm possibilities will be discussed exclusively in the Premium Forum with intense model analysis leading up to any major snow, ice, or rain events, not publicly. To join this discussion and hear the updated thoughts from our team, visit The My Pocket Meteorologist Page by clicking HERE and select the "Premium Weather Forum" option.
Precipitation Discussion
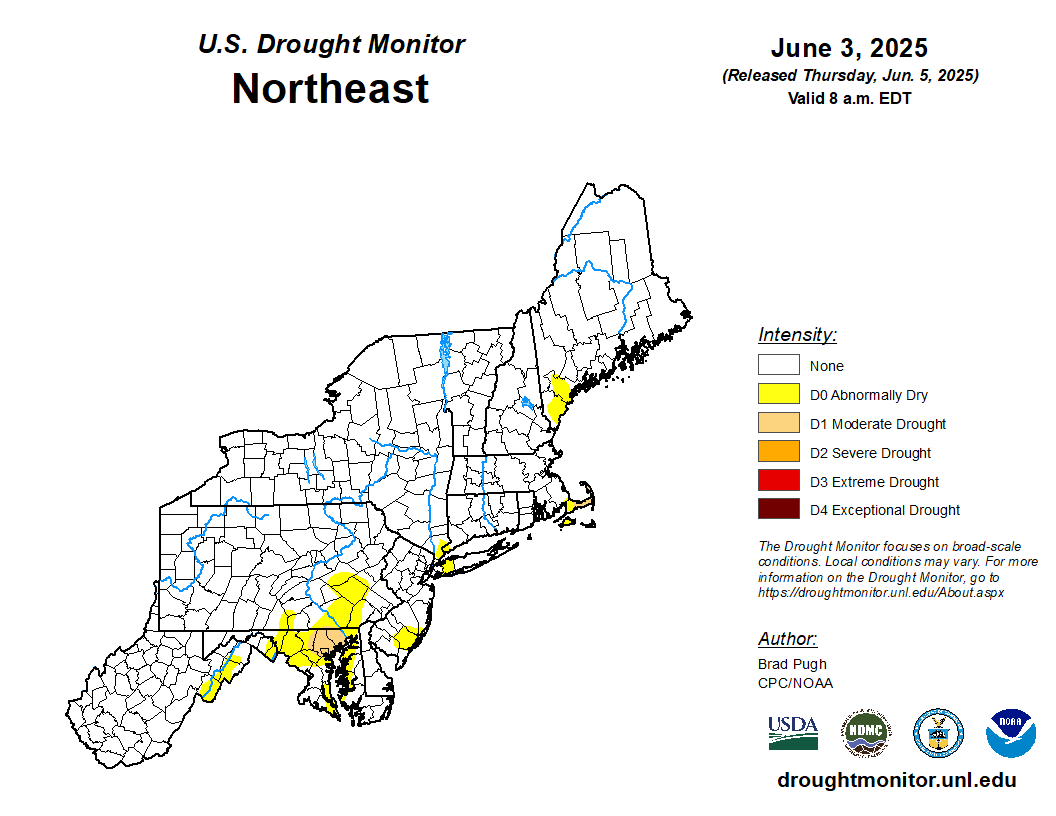
OVERVIEW: The US drought monitor (photo toward the bottom of this outlook) has been steadily improving over the past month, and for the first time since last September of 2024, there are currently NO drought areas noted within our Pennsylvania, or Delaware locales. One moderate drought area remains nearest the Baltimore metro, otherwise much of Maryland has also improved significantly. This is largely due to quite an impressive month of May with a top 5 rainfall month all-time in some locations. An area previously in a moderate drought across SE PA is now listed as abnormally dry, but this mostly deals with the water table and aquifer as soil moisture anomalies [there] are near normal. We maintained projections for June this week for a near to slightly above average (+0.0" to +1.0") precipitation departure for the month as a whole, and while we don't see a repeat this month to the likes we saw in May, precipitation leans on the slightly wetter side of average overall. July monthly projections were introduced this week for another near to slightly above average (+0.0" to +1.0") precipitation departure for the month.
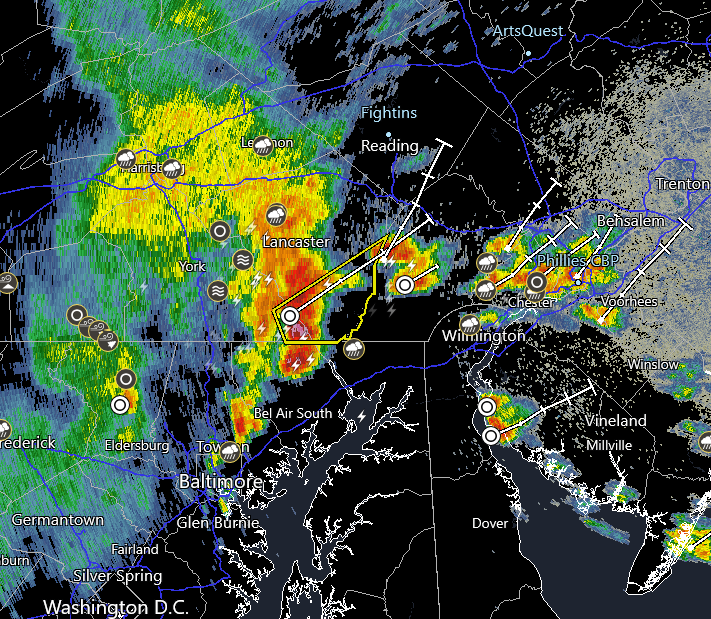
Shorter term, a cold front that has been situated off to the NW of our region will slowly work southeastward Friday, and clears the region Saturday afternoon. Scattered shower and thunderstorm activity will mainly be found in the interior locales on Friday, then as the front slips farther SE Saturday and eventually clears, the threat for showers/storms will move southeastward with the front. Low pressure will move to the west of the region Sunday and will drag a warm front through our area late Sunday and Sunday night that brings another round of scattered showers and storms, but most of Sunday is dry prior to its arrival. A cold front will cross the region Tuesday with scattered showers and thunderstorms possible.
June projections were maintained this week for a near to slightly above average (+0.0" to +1.0") precipitation departure for the month as a whole, with the expectation of a wetter than average next two week period, then near average precipitation for the remainder of June. The month of July projections were introduced this week for another near to slightly above average (+0.0" to +1.0") precipitation departure, using longer term climate models as well as seasonal trends.
Breakdown of precipitation departures from normal over the next several weeks:
June 7th - June 13th: Slightly above average
June 14th - June 20th: Near to slightly above average
June 21st - June 27th: Near average
June 28th - July 4th: Near average
July 5th - July 11th: Near to slightly above average
July 12th - July 18th: Near to slightly above average
Public/free available maps will be updated when a threat is imminent for significant weather on the weather alerts page throughout the year: http://epawaweather.com/weather-alerts/
Note: Any image below is clickable for larger viewing
Pattern Discussion
OVERVIEW: The month of June projections were maintained this week for a near to slightly above average (0.0°F to +2.0°F) temperature departure for the month as a whole. This is largely as result of milder overnight temperatures more so than daytime high extremes. Through June 5th, most of our major climate sites across the region have yet to reach the 90°F threshold, even in the "heat island" areas of Philadelphia and Reading, PA. Newark, NJ has the only 90°F observed temperature, and that was achieved one time on June 5th. It is quite possible to see NO 90°F temperatures for the remainder of June at some locations, and less than usual in the typically hotter areas across our coverage region. The month of July projections were introduced this week for a near average (-1.0°F to +1.0°F) temperature departure for the month as a whole, using long term climate guidance and seasonal/global observation trends.
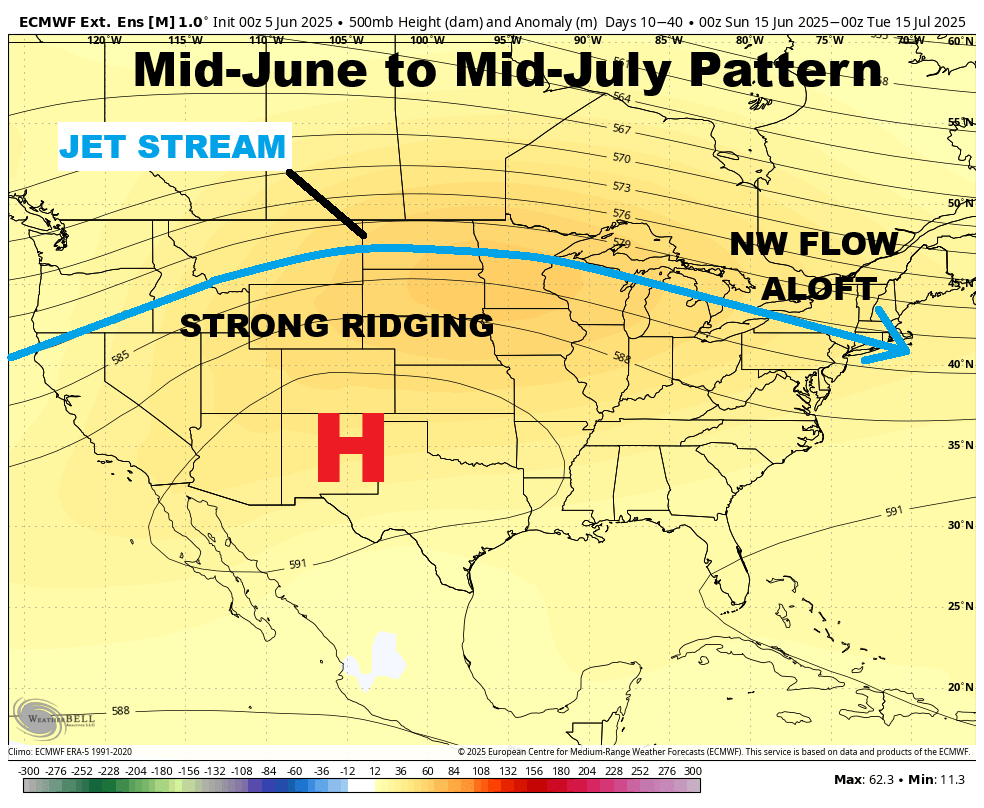
- The pattern from mid-June through mid-July will be largely temperate and absent of extremes in large part due to a strong ridge aloft setting up in the SW US and anchoring there for an extended period with little budge. This will promote the strongest heating across the country to be found in the Western US and west of the Mississippi River Valley for much of that 6/15-7/15 period. The resulting downstream effect on our area locally will be a northwesterly jet stream flow aloft that moves over and around the Western US ridging, and a more temperate (or near average) temperature regime will be the likely outcome. This type of pattern generally features fast-moving cold fronts and increased frequency of thunderstorm activity, but also limits the opportunity for temperature extremes both hotter and cooler except in transient and synoptically-driven cases.
- The Madden-Julian Oscillation (MJO) is currently in the Western Pacific phases of 6/7, and is largely expected to remain there or close to it through early next week, then collapses into the Circle of Death (COD) or NULL phase. The expectation is that from there, tropical forcing will remain in the NULL phase through mid-July. This progression allows for warmer than average temperatures (at times) through the middle of June, then after that point since tropical forcing is rather weak it should favor more seasonable temperatures mid-June through mid-July, and less in the way of abrupt cooler...or warmer extremes. This combined with the aforementioned ridging setting up for an extended period in the SW US will lead to a prolonged period of a stagnant NW flow aloft locally and a rather temperate pattern overall.
- A composite average of the SST departures in the ENSO regions places it in ENSO neutral territory as it has been for the past month and a half. The Niño 1+2 region (eastern Pacific near Peru) is the warmest of the 4 ENSO regions at +0.2°C, but all other regions (Niño 3, 3.4, and 4) are near 0.0°C and solidly in ENSO neutral territory. The expectation is for ENSO neutral to remain throughout the Summer months, which typically favors near to slightly above average temps in the June/July/August 3-month period. Near to leaning slightly average precipitation is typical of June and July, with a historically wetter than average month of August during ENSO neutral Summers within the past decade.
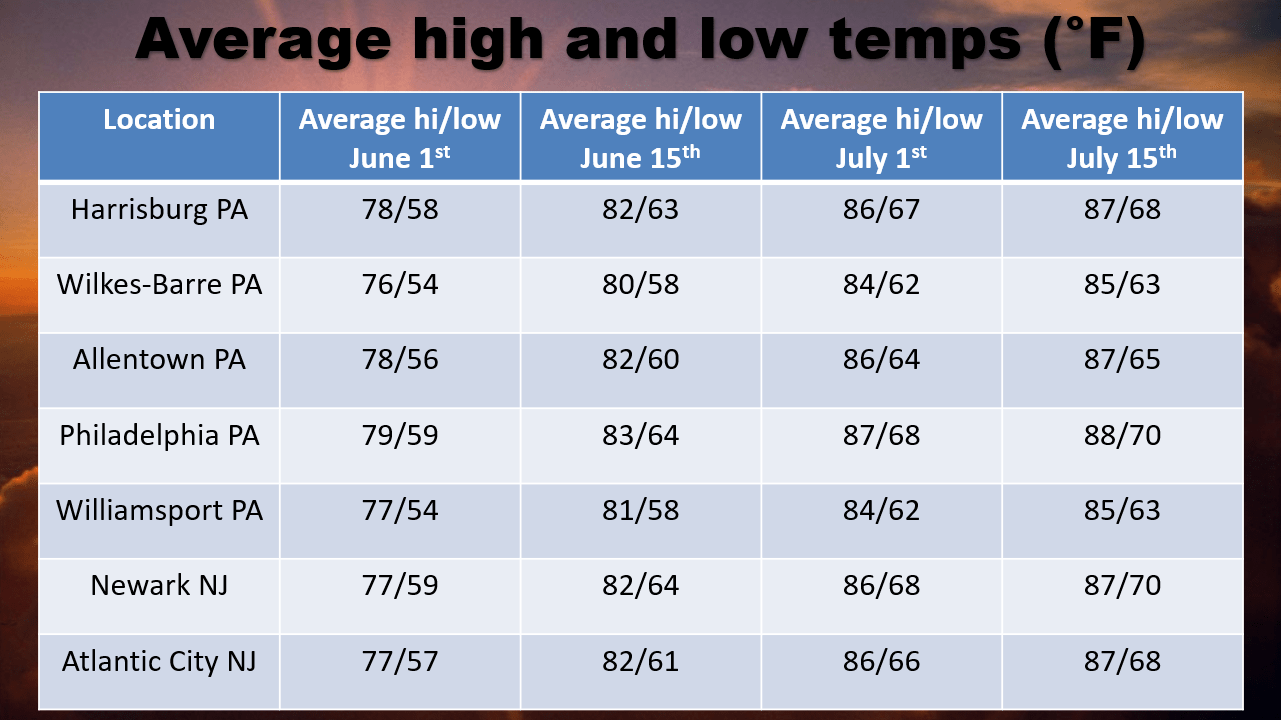
Average high temperatures are currently in the 77-80 °F range from north to south across our coverage region, which is about 1-2°F higher than at this point last week. Average high and low temperature increases will continue at about a 2.0°F gain per week throughout the entirety of June, and then peaks and reaches annual climatological maximums by mid-July. Any above or below average stretches listed in the outlook will be relative to seasonal norms at that time, and it is important to note that cooler/warmer periods will be relative to the time of year we are talking about. For example, the slightly below average temperatures listed for the June 16th-19th period generally features highs in the upper 70s to near 80, coming at a time when average highs are typically in the lower 80s. Use the average highs/lows chart below providing a point of reference and transparency for what average temperatures are at each corresponding location through July 15th.
The month of June projections were maintained this week for a near to slightly above average (0.0°F to +2.0°F) temperature departure for the month as a whole, and July projections were introduced this week for a near average (-1.0°F to +1.0°F) temperature departure for the month as a whole, using long term climate guidance and seasonal/global observation trends.
Note: Any image below is clickable for larger viewing
Long Range Outlook Table
| Date(s) | Threats | Significance | Confidence |
| 6/4-6/10 | Temperature | Near to slightly below average | Very high |
| 6/11 | Temperature | Near to slightly above average | Very high |
| 6/12-6/14 | Temperature | Slightly above average | High |
| 6/15 | Temperature | Near to slightly below average | Moderately high |
| 6/16-6/19 | Temperature | Slightly below average | Moderately high |
| 6/20-6/26 | Temperature | Near to slightly above average | Moderate |
| 6/27-7/2 | Temperature | Near to slightly above average | Moderate |
| 7/3-7/9 | Temperature | Near to slightly above average | Moderately low |
| 7/10-7/16 | Temperature | Near average | Low |
| 7/17-7/23 | Temperature | Near average | Very low |
| 6/7 | Cold front | The same cold front that has been situated to the NW of the region the past few days finally pulls through the region Saturday afternoon, and a few showers/storms are possible until it clears | High |
| 6/8 | Showers/storms | Low pressure passing west of the region drags a warm front through the region late Sunday and Sunday night, and scattered showers and thunderstorms will be possible ahead of it | Moderately high |
| 6/10 | Cold front | A cold front will cross the region Tuesday with scattered showers and thunderstorms possible | Moderately high |
| June as a whole | Temperature | Near to slightly above average (+0.0°F to +2.0°F) | Moderately high |
| June as a whole | Precipitation | Near to slightly above average (0.0" to +1.0") | Moderate |
| July as a whole | Temperature | Near average (-1.0°F to +1.0°F) | Moderate |
| July as a whole | Precipitation | Near to slightly above average (0.0" to +1.0") | Moderate |
Long range outlook table last updated: Friday June 6th, 10:15 AM. Next scheduled update: Friday 6/13.
This is a weekly updated public long range guidance product from EPAWA. For daily long range updates and more detailed updates M-F, please join the EPAWA forum.
More information/sign-up at: http://epawaweather.com/mpm/
Climatology
Please note that as time moves forward into a different period as shown above, average temperatures for those dates will also change. The departure from normal uses the average temperature for the date, averaging temps over 24 hours for any given location, using both high and low temperatures hourly during any particular day. This outlook determines warm vs. cool periods relative to normal temperatures.
See the example below using Philadelphia, PA as the climate station:
| Date | Average Hi/Lo (°F) | Current EPAWA projection |
| June 7th | 81°F/61°F | Near to slightly below average |
| June 14th | 83°F/64°F | Slightly above average |
| June 21st | 85°F/66°F | Near to slightly above average |
| June 28th | 87°F/68°F | Near to slightly above average |
| July 5th | 88°F/69°F | Near to slightly above average |
| July 12th | 88°F/70°F | Near average |
| July 19th | 88°F/70°F | Near average |
Climate Prediction Center (CPC) Graphical Products
These products are from the NOAA Climate Prediction Center (CPC) and do not necessarily reflect the EPAWA forecast which is detailed above. All images below update automatically as the CPC releases new graphical products


U.S. Soil Moisture Anomaly

US drought monitor (NE US)
Current Conditions
Interactive Radar
Long Range Outlook

Weather Alerts and Maps
Our Sponsors


Forecaster: EPAWA Meteorologist Bobby Martrich
Discussion last updated: Friday June 6th, 2025 10:15 AM