EPAWA's weekly Long Range Outlook

EPAWA's long range outlook is updated weekly every Friday morning before noon

Long range outlook last updated: Friday July 25th, 2025, 10:00 AM

Technical discussion is below for advanced readers:

Technical discussion below will feature two (2) subcategories: Precipitation, and Pattern Discussion. Storm possibilities will be discussed exclusively in the Premium Forum with intense model analysis leading up to any major snow, ice, or rain events, not publicly. To join this discussion and hear the updated thoughts from our team, visit The My Pocket Meteorologist Page by clicking HERE and select the "Premium Weather Forum" option.

Precipitation Discussion

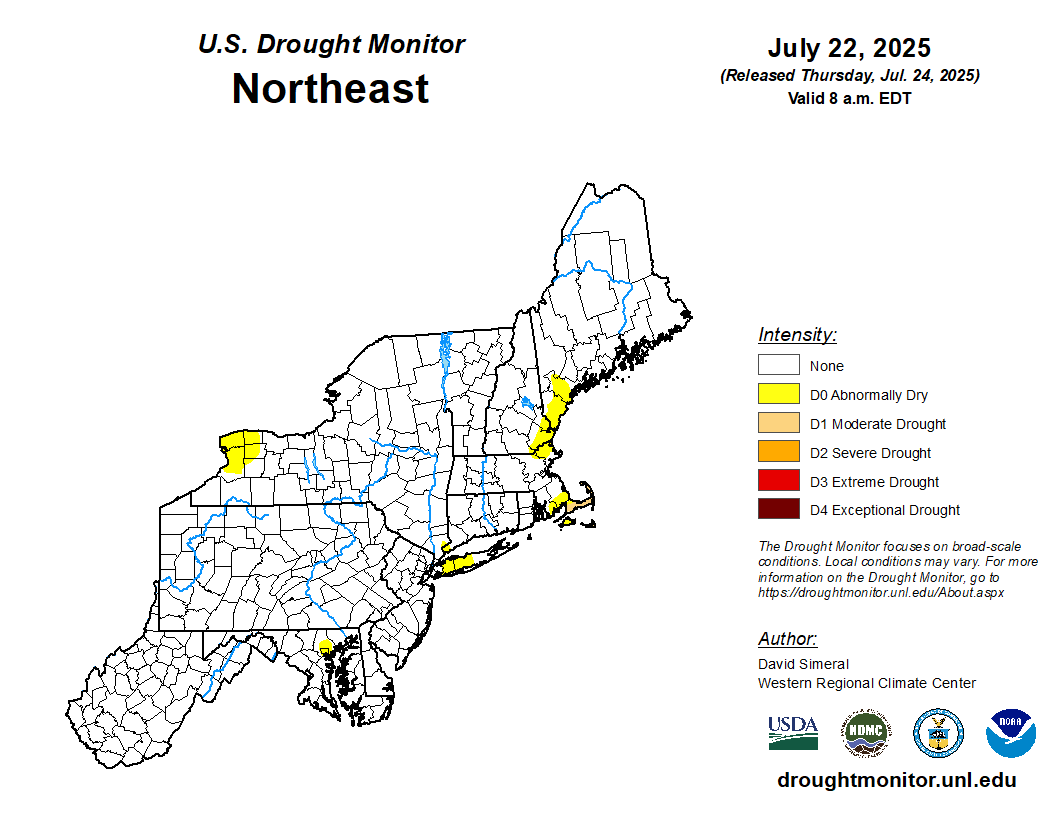
OVERVIEW: The US drought monitor (photo toward the bottom of this outlook) maintains NO drought areas within our Pennsylvania, New Jersey, or Delaware locales. One abnormally dry area remains over Southern Baltimore County in Maryland, otherwise the remainder of Maryland has no drought designation. This is largely due to quite an impressive month of May with a top 5 rainfall month all-time in some locations, and generally near average precipitation following in June, and near average precipitation thus far in July. Going forward, the month of July as a whole projections were slightly adjusted this week to a near average (-0.5" to +0.5") precipitation departure for the month as a whole. August monthly projections were maintained this week for a near average (-0.5" to +0.5") precipitation projection in accordance with longer term climate models and global observation trends.

Shorter term, a cold front will move through the region Friday, then stalls to the SW of the region on Saturday. It returns northeastward as a warm front Saturday night and Sunday, leading to scattered showers and perhaps thunderstorms from later Saturday night through Sunday morning. Until the system fully clears, scattered thunderstorms will still be possible Sunday afternoon. It returns to hot and humid conditions in the early to middle part of next week, then a cold front arrives Wednesday or Wednesday night effectively ending the heat/humidity and a week or longer of slightly below average temperatures and more comfortable humidity will follow. Scattered showers/storms will be possible with that front Wednesday, then a mostly dry week will follow accompanying the aforementioned cooler airmass. Next cold front is due to arrive near August 6th. 

The month of July projections were slightly lowered this week to a near average (-0.5" to +0.5") precipitation departure, with the expectation that overall precipitation events and frequency will be limited over the last week of this month. The month of August projections for the month as a whole were maintained this week to a near average (-0.5" to +0.5") precipitation departure, using longer term climate models as well as seasonal trends.

Breakdown of precipitation departures from normal over the next several weeks:

July 26th - August 1st: Near to slightly above average

August 2nd - August 8th: Near to slightly below average

August 9th - August 15th: Near to slightly above average

August 16th - August 22nd: Near to slightly above average

August 23rd - August 29th: Near to slightly below average

August 30th - September 5th: Near to slightly below average


Public/free available maps will be updated when a threat is imminent for significant weather on the weather alerts page throughout the year:  http://epawaweather.com/weather-alerts/

Note:  Any image below is clickable for larger viewing  

A stalled boundary to our southwest will return northward as a warm front Saturday night into Sunday morning bringing scattered showers, then scattered t-storms possible Sunday afternoon
A hot and humid early to midweek period will be ended by a cold front that moves through on Wednesday or Wednesday night, accompanied by scattered showers and thunderstorms

Pattern Discussion

OVERVIEW:  The month of July projections were slightly adjusted this week to a slightly above average (+1.0°F to +3.0°F) temperature departure for the month as a whole, with several above average temperature days expected within the final week of the month. August projections for the month as a whole were maintained this week for a near to slightly above average (+0.0°F to +2.0°F) temperature projection using long term climate guidance and seasonal/global observation trends, and the expectation of a cooler start to the month balanced by overall warmer than average conditions after the first 10 days of August.

  • The overall pattern through for the remainder of July features generally above average temperatures with the exception of Sunday 7/27 when clouds and precipitation will limit temperatures somewhat, and the final day of the month in the wake of a cold front. The best ridging in the US will shift westward to the four corners region (UT/CO/AZ/NM) toward the end of the month, allowing for a NW flow aloft to develop locally. This will bring cooler than average conditions to begin August for the first 7-10 days until that ridge flattens and the flow becomes more zonal. This is in response to Western Pacific tropical forcing this week which typically favors this type of set-up.  

  • The Madden-Julian Oscillation (MJO) is currently in phase 6 in the Western Pacific, and is largely expected to quickly move into phase 7 before collapsing into the Circle of Death (COD) or NULL phase by the middle of next week. This typically promotes the Western US ridging and NW flow aloft locally that we expect to begin Augusts, which leads to slightly below average temperatures in the current ENSO neutral background state. Once tropical forcing reaches the COD, about a week to 10 days later we're likely to see a more zonal flow develop, leading to more typical summerlike conditions returning.

  • A composite average of the SST departures in the ENSO regions places it in ENSO neutral territory as it has been for the past several months. The Niño 1+2 region (eastern Pacific near Peru) is currently the warmest of the 4 ENSO regions at +0.1°C, whereas the other regions (Niño 3 and Niño 4) are near -0.1°C, and  Niño 3.4 is currently -0.2°C, placing the entire Pacific basin solidly in ENSO neutral territory. The expectation is for ENSO neutral to remain throughout the Summer months, which typically favors near to slightly above average temps in the June/July/August 3-month period, and near to slightly above average precipitation is typical of July and August. 

Average high temperatures are currently in the 85-88 °F range from north to south across our coverage region, which is still within the peak annual climatological maximums period, and the highest average temperatures of the year. These maximums will slowly abate over the coming weeks heading into August. Any above or below average stretches listed in the outlook will be relative to seasonal norms at that time, and it is important to note that cooler/warmer periods will be relative to the time of year we are talking about. For example, the slightly below average temperatures listed for the July 31st-August 6th period generally features highs in the lower 80s, coming at a time when average highs are typically in the mid-upper 80s. Use the average highs/lows chart below providing a point of reference and transparency for what average temperatures are at each corresponding location through September 15th

The month of July projections were slightly adjusted this week to a slightly above average (+1.0°F to +3.0°F) temperature departure for the month as a whole, with the expectation of an overall above average final week of July sans two of those days. The month of August as a whole was maintained this week for another near to slightly above average (+0.0°F to +2.0°F) temperature projection, using long term climate guidance and seasonal/global observation trends. 


Note:  Any image below is clickable for larger viewing

Average temperatures over the next 6 weeks are shown above at our major climate sites throughout the region, with annual average maximums currently that will slowly drop off thereafter
Hot temperatures in the early to middle part of next week will be ended by a cold front, which brings a sustainable cooler stretch in early August with more comfortable temps and humidity levels

Long Range Outlook Table


Date(s)ThreatsSignificanceConfidence
7/26TemperatureNear to slightly above averageVery high
7/27TemperatureNear to slightly below averageVery high
7/28-7/30TemperatureSlightly above to above averageHigh
7/31-8/6TemperatureSlightly below averageModerately high
8/7-8/10TemperatureNear to slightly below averageModerate
8/11-8/17TemperatureSlightly above averageModerate
8/18-8/24TemperatureNear to slightly above averageModerately low 
8/25-8/31TemperatureNear to slightly above averageLow
9/1-9/7TemperatureSlightly above averageVery low
7/27Warm frontA previously stalled frontal boundary to our southwest will return NE as a warm front Saturday night into Sunday AM with scattered showers and storms, with storms still possible Sunday afternoonHigh
7/30Cold frontA cold front arrives late Wednesday with scattered showers and thunderstorms possible, and this will effectively end the higher heat/humidity for the next week as a trough settles into the regionModerately high
8/6Cold frontAfter over a week of dry and temperate conditions, another cold front arrives in the middle of the following week with showers and thunderstorms Moderate
July as a wholeTemperatureSlightly above average (+1.0°F to +3.0°F)High
July as a wholePrecipitationNear average (-0.5" to +0.5")High
August as a wholeTemperatureNear to slightly above average (+0.0°F to +2.0°F)Moderately high
August as a wholePrecipitationNear average (-0.5" to +0.5")Moderate


Long range outlook table last updated: Friday July 25th, 10:00 AM. Next scheduled update: Friday 8/1.

This is a weekly updated public long range guidance product from EPAWA. For daily long range updates and more detailed updates M-F, please join the EPAWA forum.

More information/sign-up at: http://epawaweather.com/mpm/ 

Climatology

*Indications of above or below average temperatures in the table above are relative to what is considered "normal" using data collected over the long term for a particular date. This is collected and maintained by the National Climatic Data Center in conjunction with the National Weather Service actual data from previous years collected at official ASOS/climatology stations across our coverage area. Also note that as time moves forward into a different period as shown above, average temperatures for those dates will also change. See the example below using Philadelphia, PA as the climate station, which represents out projections on that precise date listed:

DateAverage Hi/Lo (°F)Current EPAWA projection
July 26th88°F/70°FNear to slightly above average
August 2nd87°F/70°FSlightly below average
August 9th87°F/69°FNear to slightly below average
August 16th86°F/68°FSlightly above average
August 23rd85°F/67°FNear to slightly above average
August 30th84°F/66°FNear to slightly above average
September 6th82°F/64°FSlightly above average

The departure from normal uses the average temperature for the date, averaging temps over 24 hours for any given location, using both high and low temperatures hourly during any particular day. This outlook determines warm vs. cool periods relative to normal temperatures.

Climate Prediction Center (CPC) Graphical Products

These products are from the NOAA Climate Prediction Center (CPC) and do not necessarily reflect the EPAWA forecast which is detailed above. All images below update automatically as the CPC releases new graphical products

CPC 6-10 day temperature outlook
CPC 6-10 day precipitation outlook
CPC 8-14 day temperature outlook
CPC 8-14 day precipitation outlook
CPC weeks 3-4 temperature outlook
CPC weeks 3-4 precipitation outlook
CPC next 3 months temperature outlook
CPC next 3 months precipitation outlook

U.S. Soil Moisture Anomaly

Below is a look at the latest Soil Moisture Anomaly for the Contiguous United States. This is used by NOAA/CPC for the purpose of drought monitoring and drought outlooks. This image will automatically update daily.

US drought monitor (NE US)

Current Conditions

Interactive Radar

Long Range Outlook

Weather Alerts and Maps

Our Sponsors

Forecaster: EPAWA Meteorologist Bobby Martrich
Discussion last updated: Friday July 25th, 10:00 AM