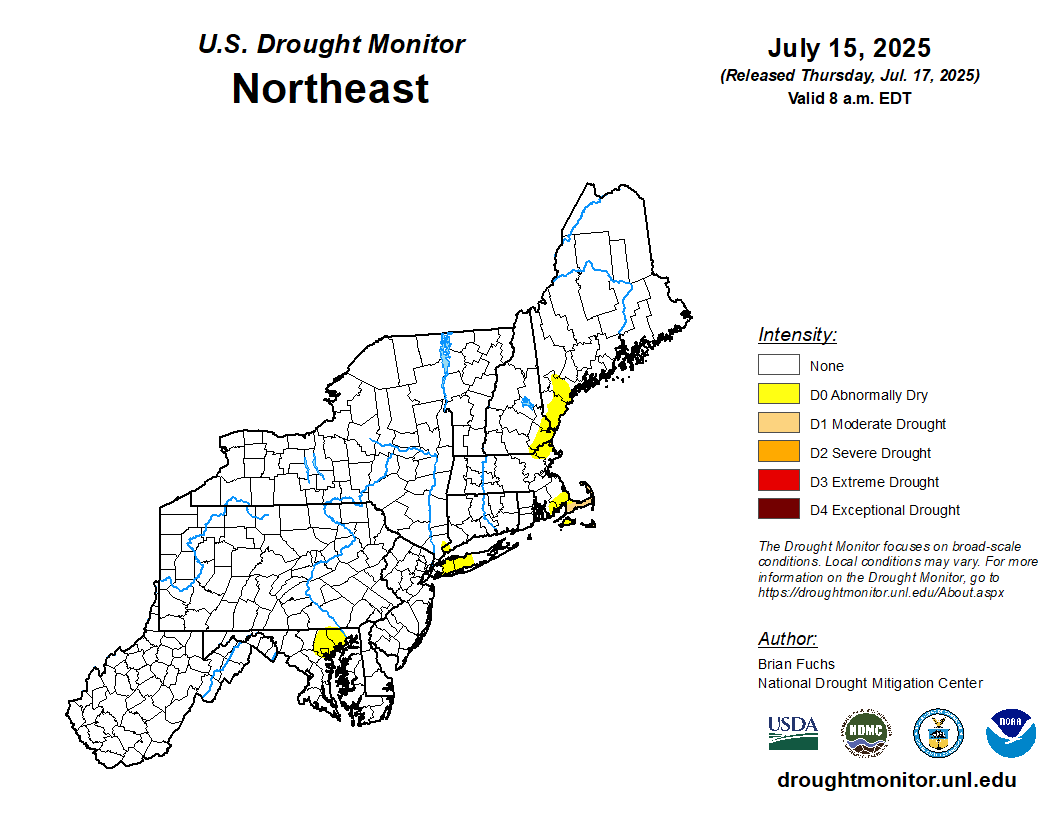
OVERVIEW: The US drought monitor (photo toward the bottom of this outlook) maintains NO drought areas within our Pennsylvania, New Jersey, or Delaware locales. One abnormally dry area remains over Baltimore and Harford Counties in Maryland, otherwise the remainder of Maryland has no drought designation. This is largely due to quite an impressive month of May with a top 5 rainfall month all-time in some locations, and generally near average precipitation following in June, and near to slightly above average precipitation thus far in July. Going forward, the month of July as a whole projections were slightly adjusted this week to a near to slightly above average (+0.0" to +1.0") precipitation departure for the month as a whole. August monthly projections were also adjusted this week to a near average (-0.5" to +0.5") precipitation projection in accordance with longer term climate models and global observation trends.
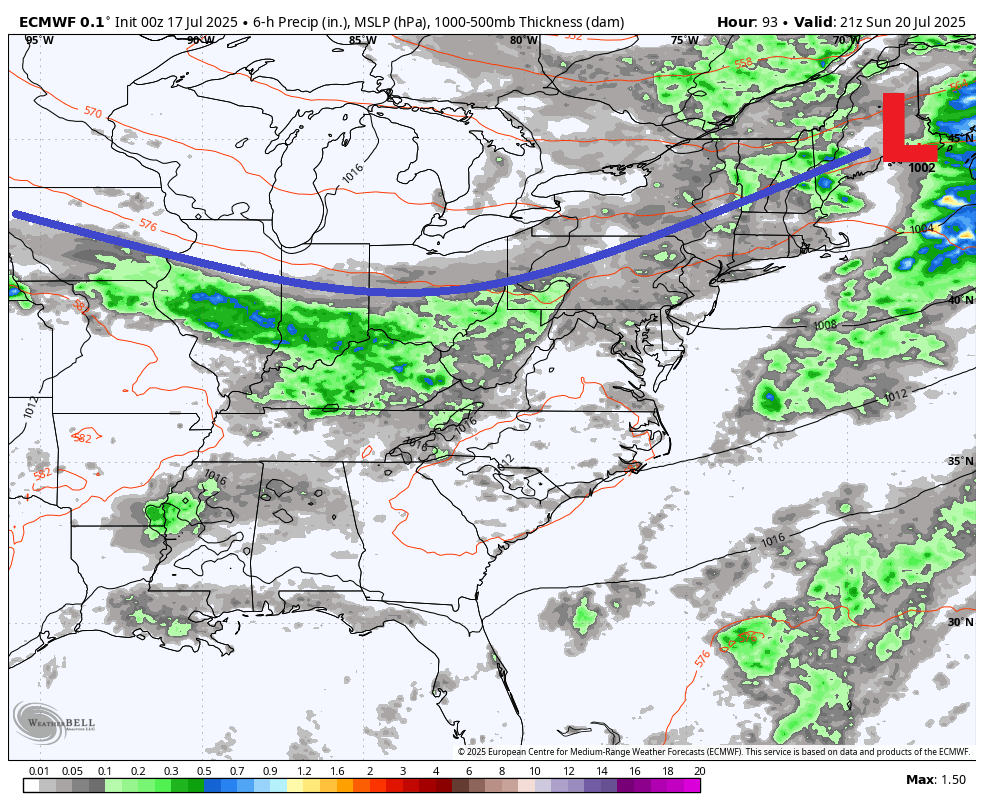
Shorter term, the cold front that moved through late Thursday will stall to the south of the region Friday, and remains there to begin Saturday. Late Saturday and Saturday evening, the front returns northward as a warm front, and at the same time, low pressure will traverse this boundary and bring scattered showers Saturday night. This activity ends by daybreak Sunday, then a cold front quickly follows Sunday afternoon with scattered thunderstorms possible. In the wake of that front, high pressure builds in early next week, then moves offshore later in the week.
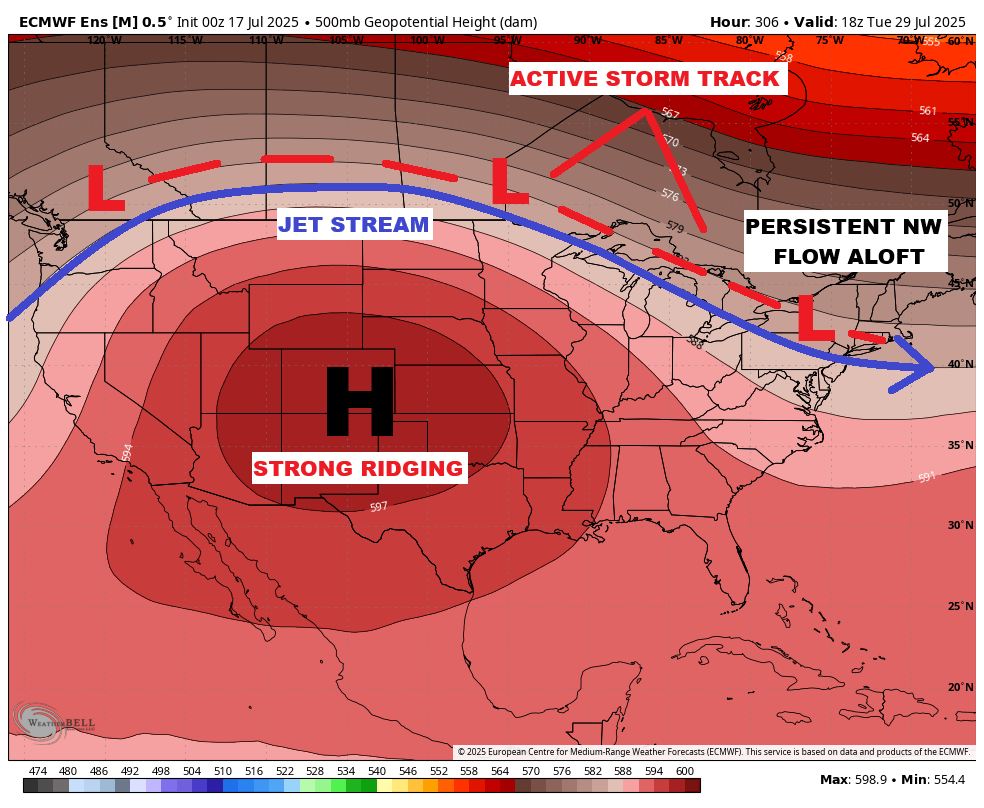
The month of July projections were slightly lowered this week to a near slightly above average (+0.0" to +1.0") precipitation departure, with the expectation that overall precipitation events and frequency will abate somewhat beginning next week. The month of August projections for the month as a whole were also adjusted this week to a near average (-0.5" to +0.5") precipitation departure, using longer term climate models as well as seasonal trends.
Breakdown of precipitation departures from normal over the next several weeks:
July 19th - July 25th: Near average
July 26th - August 1st: Near to slightly below average
August 2nd - August 8th: Near average
August 9th - August 15th: Near to slightly above average
August 16th - August 22nd: Near average
August 16th - August 22nd: Near to slightly below average
Public/free available maps will be updated when a threat is imminent for significant weather on the weather alerts page throughout the year: http://epawaweather.com/weather-alerts/
Note: Any image below is clickable for larger viewing